If you’re looking for freedom from financial constraints, then learning how to read forex charts is a great place to start. With some basic knowledge of technical analysis tools such as trendlines, support/resistance levels, or chart patterns like triangles or wedges; you’ll be able to identify entry points that are likely to result in profits rather than losses. It doesn’t matter if you’re just starting out or already have years of experience under your belt – everyone needs help understanding these concepts at first!
So let’s get started! By the end of this article, you’ll know all there is to know about reading and interpreting forex charts so that you can capitalize on market trends and maximize your potential profits. Let’s dive right in!
Contents
Discovering Forex Chart Patterns
The Forex charts are like a highway map for traders. They can unlock the secrets of the market and guide you to success. Like a navigator on an open road, mastering chart patterns can help you reach your destination with ease.
It’s not just about following the trends; it’s about understanding how they form in the first place. To read forex charts effectively, one must be able to identify key patterns that indicate potential trading opportunities. From double tops and bottoms to head-and-shoulders formations, these powerful tools tell us when to buy or sell – helping to maximize our profits while minimizing our risks.
Understanding chart patterns is essential for any aspiring trader who wants to make money in foreign exchange markets. With practice, applying these techniques will become second nature – enabling them to confidently explore new and exciting trading strategies with confidence. By embracing their inner explorer, traders have limitless possibilities at their fingertips as they navigate their way through uncharted waters towards financial freedom!
Reading Line Charts
Reading line charts is a skill that can revolutionize your Forex trading. By studying the trends and patterns presented in these charts, traders can get an edge on anticipating market movements and capitalizing on opportunities.
It’s incredibly simple to read line charts – they represent changes in price over time, with each point showing both the open and close of a session. As you look at the chart, it’ll become evident what kind of pattern may be emerging – whether it’s bullish or bearish. To identify potential areas of support or resistance, traders should watch for any signs of reversal points such as double tops or bottoms. Studying these lines will give you valuable insight into how prices are likely to move in the future.
As a trader, being able to spot these patterns quickly gives you an advantage when entering trades. Learning how to interpret line charts is an essential part of improving your skillset and increasing your chances of success in Forex trading. With practice, anyone can master reading forex line charts and unlock their full earning potential!
Reading Candle Charts
Candlestick charts are a popular way of reading the Forex market. They provide a snapshot into price movements, giving traders an insight into where prices have been and potential areas they may go in the future. At first glance, these charts can seem intimidating to those who’ve never used them before – but once you understand how to read them correctly, they become invaluable tools for your trading arsenal!
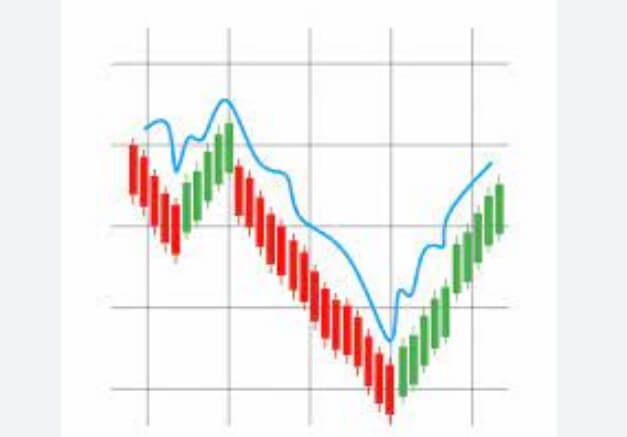
Reading candlestick charts is actually quite simple: each candle on the chart represents one period (typically days) of price action. The body of the candle shows the open and close prices during that period; if it’s green then the close was higher than the open, while if it’s red then the close was lower than its opening value. Upper and lower wicks represent high and low values respectively. Once you get familiar with this setup, you’ll be able to quickly identify trends and spot buying/selling opportunities in real-time.
It pays off to learn about candlestick charts because they offer more information than line charts do. With their help, we can easily track patterns over time as well as make confident decisions when entering or exiting trades. Plus, they show us not just what happened but also why – which makes it much easier to fine-tune our strategy going forward. All in all, having a good grasp of candlestick analysis will give any trader a major edge in today’s competitive markets!
Reading Bar Charts
It is often said that bar charts are a more powerful tool for Forex traders than candlestick charts. But is this really the case? Let’s take a closer look and explore how to read bar charts in order to make informed decisions when trading forex.
When reading bar charts, it’s important to understand the information they display. Each bar represents the open, high, low and close of the asset over a certain period of time. They provide insight into current price action as well as overall market sentiment across different timeframe periods. The opening value shows where buyers entered while closing values indicate where sellers exited. Using these pieces of data, traders can identify trends or possible entry/exit points within their strategies with greater accuracy.
Bar charting gives you an edge in your trades by providing clear insights into price movements and momentum shifts – both on short-term scales and long-term scales. Armed with this knowledge, you’re able to better predict future price movement which helps increase your chances of success in forex trading significantly! With its ability to help simplify complex technical analysis tasks, learning how to use bar charts properly will give you a leg up against other traders who may not be aware of their true potential.
Reading Renko Charts
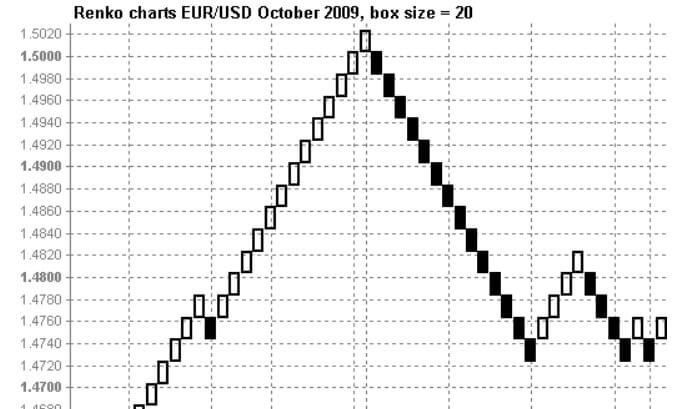
Renko charts are a great way to read Forex data and make trading decisions. They’re easy-to-use, flexible, and provide traders with an intuitive snapshot of the market’s movement. Unlike other chart types, Renko doesn’t rely on time or volume as indicators – it creates blocks when price moves by fixed amounts in either direction. This makes them highly useful for spotting trends, support levels, and resistance points.
Trading with Renko can be quite profitable if you know how to interpret its signals correctly. The first step is to identify whether there’s an uptrend or downtrend in the currency pair by looking at the formation of bricks (the colored boxes). If they’re mostly headed one way then that should give you some indication of which direction the overall trend is going. Then look out for patterns like breakouts and reversals based on where prices move relative to preceding structures such as support & resistance lines or channels. With this information, you can anticipate potential changes in momentum and plan your trades accordingly!
Pros’ Tricks To Analyze Charts
Trading Forex can be like navigating a roller coaster ride. It takes knowledge, effort and skill to make it to the top. But with the right approach and tricks up your sleeve, you’ll soon be zooming along on that trading path! Let’s take a look at some of the pros’ tricks for analyzing charts and getting ahead in this exciting market.
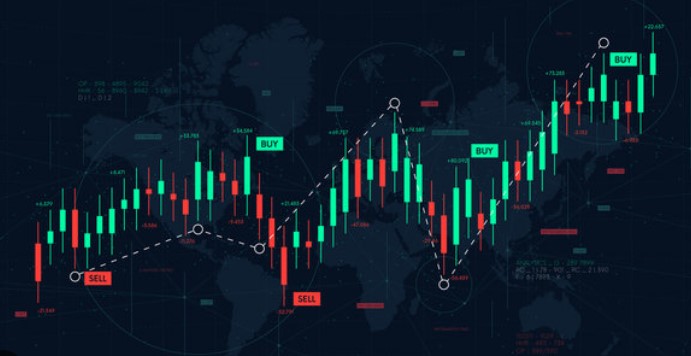
Chart analysis is one of the most important aspects of any successful trader’s strategy. To really get ahead in Forex trading, understanding how to read price action is essential. Whether you’re using Renko or candlestick charts – learning what each type reveals about underlying market trends can arm you with invaluable insights into when it may be time to buy or sell. Additionally, recognizing technical signals such as support/resistance levels, trendlines, and Fibonacci retracements will help you spot potential entry points – allowing you to capitalize on lucrative opportunities as they arise.
It also pays off to keep an eye on economic news releases; these days there are numerous resources available which provide timely updates so traders don’t miss out on major announcements that could impact their positions significantly. By staying abreast of industry developments and having a clear grasp of financial fundamentals, savvy investors can better anticipate pricing movements and remain one step ahead of the competition.
Conclusion
I’ve shared with you the basics of reading forex charts, from line to Renko. Now it’s time for me to share some tricks of the trade that experienced traders use when analyzing charts.
First, focus on key support and resistance levels- these are areas where price may pause or reverse direction. Also pay attention to chart patterns like head and shoulder formations and double tops and bottoms- they can give valuable clues about a potential trend reversal. Finally, don’t forget indicators – they’re powerful tools used by many pros to help identify trends in price movements.
To sum up my advice on how to read forex charts: remember the basic types of charts, spot key levels, watch out for chart patterns, and employ helpful indicators. With practice and patience I’m sure you’ll soon be able to interpret the market like a pro!