
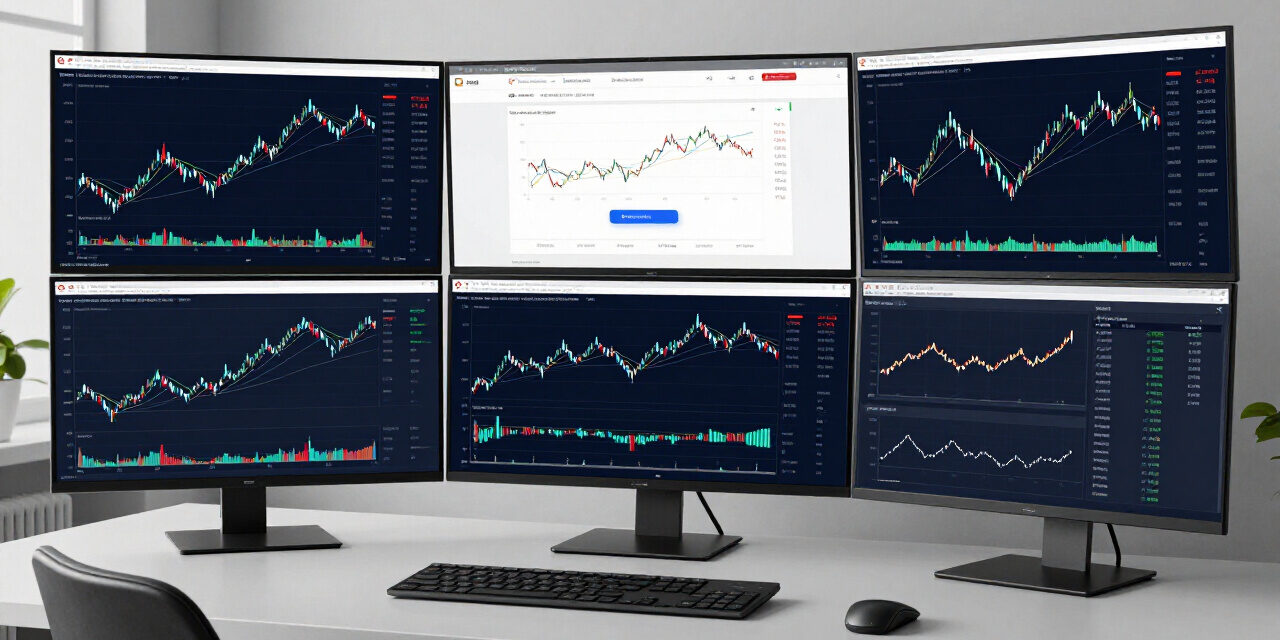
Profitable forex trading in 2026 demands more than basic technical analysis, requiring a sophisticated integration of institutional order flow and algorithmic price action. Markets react to complex liquidity pools and central bank interest rate differentials, making consistency elusive for traders relying on outdated indicators. True success hinges on capturing high-probability setups that leverage structural market shifts rather than chasing transient volatility.
Risk management remains the primary differentiator between sustained growth and capital depletion. Mastery involves aligning risk-to-reward ratios with prevailing macroeconomic trends while strictly mitigating slippage and execution costs. This analysis deconstructs the most reliable forex trading strategies for the upcoming fiscal year, focusing on data-driven methodologies that withstand diverse market environments. By optimizing entry precision and exit triggers, you can transition from speculative gambling to a disciplined, institutional approach that prioritizes long-term compounding of your trading equity.
Overview of Discretionary Trading Frameworks
Discretionary trading frameworks rely on structured rule-based systems that combine technical price action analysis with systematic risk management. Traders analyze price structure, market liquidity, and institutional volume to make manual entry and exit decisions rather than relying entirely on algorithmic automated execution models.
Professional foreign exchange trading requires structured methodologies to navigate daily market volatility. Discretionary systems empower traders to adapt to changing market conditions while preserving capital through strict risk controls.
Trading frameworks define exact criteria for entry timing, stop-loss placement, and profit-taking targets. Without systematic rules, currency trading devolves into emotionally driven decision-making that leads to rapid capital depletion.
- Currency pairs display unique volatility profiles and liquidity traits throughout different trading sessions.
- Systematic execution structures ensure that market operators execute setups with repeatable edge across changing market cycles.
Successful institutional market participants utilize structured technical frameworks combined with strict position sizing models. These execution systems balance trade probability, risk exposure, and expected financial returns.
| Trading Framework | Primary Timeframe | Target Volatility | Execution Style |
|---|---|---|---|
| London Breakout | M5 to M15 | High Session Open Volatility | Momentum Breakout |
| Moving Average Trend | H4 to D1 | Sustained Macro Trends | Trend Continuation |
| Order Block / FVG | M15 to H1 | Institutional Imbalance | Mean Reversion / Order Flow |
| Multi-Timeframe Momentum | M15 to H4 | Cyclical Swing Swings | Pullback Execution |
| Macro Carry Trade | D1 to W1 | Yield Spreads | Fundamental Position Trading |
Top 5 High-Probability Forex Trading Strategies
High-probability forex trading strategies isolate recurring structural market inefficiencies using price action, institutional liquidity zones, and dynamic momentum filters. By aligning session timing, market structure shifts, and systematic trade management, these technical strategies deliver repeatable statistical edges across major currency pairs.
1. London Open Breakout Strategy
The London open breakout strategy capitalizes on the massive influx of institutional liquidity when European financial markets open. Traders define the Asian session consolidation range and enter breakout orders in the direction of the early London momentum surge to capture rapid intraday price expansion.
The Asian trading session frequently establishes a tight, low-volatility price range across major European currency pairs like EUR/USD and GBP/USD. This consolidation period reflects lower trading volumes prior to London opening.
- Analyzing the best time to trade forex shows that European market open produces the highest volume surge of the trading day.
- This sudden liquidity injection triggers rapid breakouts beyond established Asian session extremes.
Traders measure the high and low price boundaries established during the four hours preceding the London open. Stop-entry orders are placed slightly outside these boundary levels to capture explosive breakout momentum.
Stop-loss placement sits at the midpoint of the Asian consolidation range or the opposing boundary. Profit targets are set using a fixed 1:2 risk-to-reward ratio or key daily support and resistance levels.
- Target Pairs: GBP/USD, EUR/USD, GBP/JPY
- Execution Window: 07:00 to 10:00 UTC
- Average Win Rate: 52% to 58%
- Primary Advantage: Rapid trade completion within peak liquidity hours
Pros: Clear objective boundaries; requires minimal screen time; catches major daily trend expansions early.
Cons: Susceptible to false liquidity sweeps; elevated slippage during economic news releases.
2. Daily Trend Continuation with Moving Averages
The daily trend continuation strategy aligns intraday pullbacks with higher timeframe direction using exponential moving averages. Traders wait for price to retrace toward dynamic value zones, like the 20-day or 50-day EMA, before executing trade entries in alignment with the overarching macro trend.
Higher timeframe trends carry significantly more market memory and volume than lower timeframe price fluctuations. Trading in alignment with daily charts increases directional probability and reduces trade execution noise.
Evaluating trend structure alongside the best forex indicators clarifies momentum direction during deep retracements. Exponential moving averages smooth price action to expose structural market bias clearly.
When the 20-day EMA resides above the 50-day EMA, the market exhibits a bullish macro structure. Traders wait for price to retrace back toward the EMA dynamic support layer.
Entry triggers require a reversal candlestick pattern, such as a bullish pin bar or engulfing candle, directly touching the EMA zone. The stop-loss is placed below the recent swing low point.
- Target Pairs: EUR/USD, AUD/USD, USD/JPY, NZD/USD
- Execution Window: Daily candle close
- Average Win Rate: 48% to 55%
- Primary Advantage: High risk-to-reward ratios on macro moves
Pros: Low frequency trading reduces broker commission costs; strong directional reliability; minimal stress.
Cons: Requires patience for setup formation; extended drawdown periods during ranging markets.
3. Fair Value Gap and Order Block Trading (ICT/SMC)
Fair Value Gap and Order Block strategies exploit institutional liquidity footprints left by large market participants. Traders identify three-candle imbalance areas and structural order blocks on intraday charts, placing limit orders at these precise points where big banks recapitalize prior positions.
Institutional market participants cannot execute large position sizes instantly without causing massive price slippage. They create localized price imbalances visible as three-candle Fair Value Gaps (FVG) on technical charts.
When price moves aggressively away from a consolidated area, it leaves an unfilled price gap. Market structure dictates that price frequently returns to rebalance these inefficient liquidity gaps.
Traders mark the high of the first candle and the low of the third candle in a three-candle bullish expansion sequence. A limit buy order is placed at the upper edge of the identified gap.
Risk is strictly defined below the structural order block that generated the aggressive move. Profit targets focus on opposing pool liquidity resting above equal highs or previous daily extremes.
- Target Pairs: EUR/USD, GBP/USD, USD/CAD
- Execution Window: New York and London session overlaps
- Average Win Rate: 50% to 62%
- Primary Advantage: Exceptionally tight stop-loss placement allowing high payoff ratios
Pros: High precision entries; alignment with institutional order flow; high potential risk-reward metrics.
Cons: Requires complex chart analysis; subjective gap identification; higher execution discipline needed.
4. Multi-Timeframe Momentum Pullback Strategy
Multi-timeframe momentum pullback trading verifies macro trend bias on daily charts while using lower timeframes like fifteen-minute charts to trigger entries. Traders utilize oscillator divergences and structural market shifts to enter trades at optimal pricing with tight risk parameters.
Analyzing multiple timeframes simultaneously prevents traders from taking short positions into higher timeframe support levels. Higher timeframes dictate market direction while lower timeframes provide precision entry timing.
The setup begins by confirming directional bias on the four-hour chart using higher highs and higher lows. Once established, the trader switches to the fifteen-minute chart to evaluate tactical entry points.
Traders monitor the Relative Strength Index (RSI) on the fifteen-minute chart during retracements. An oversold RSI reading combined with structural market support signals trade execution readiness.
Entry occurs when price breaks the immediate counter-trend trendline on the lower timeframe chart. The stop-loss is placed below the local swing low, targeting the higher timeframe swing high.
- Target Pairs: EUR/JPY, GBP/JPY, AUD/JPY, EUR/GBP
- Execution Window: London and New York sessions
- Average Win Rate: 54% to 60%
- Primary Advantage: Combines macro directional probability with tight intraday risk parameters
Pros: Smooth equity curves; manageable drawdowns; versatile across multiple currency assets.
Cons: Demands active screen monitoring; requires strict alignment discipline across multiple timeframes.
5. FX Carry Trade and Macro Yield Differential Setup
The FX carry trade strategy exploits national interest rate differentials by purchasing currencies yielding high interest against low-yielding funding currencies. Traders capture daily interest rate swaps while aligning long-term fundamental yield spreads with technical trend structure on higher timeframes.
Central bank monetary policy creates significant yield differentials between global sovereign currencies. Capital flows naturally toward higher-yielding assets, driving long-term directional trends across foreign exchange markets.
Traders analyzing capital allocation through the best forex signal providers evaluate swap rate distributions alongside macro technical trends. Combining fundamental yields with technical trend structures yields robust long-term positioning.
The strategy involves going long on a currency pair where the base currency offers a substantially higher interest rate than the quote currency. Position holders accrue positive daily swap payments.
Technical entry parameters require weekly chart alignment with the fundamental yield spread. Stop-loss orders sit below major multi-month technical swing levels to survive minor market fluctuations.
- Target Pairs: USD/JPY, AUD/JPY, NZD/JPY, USD/CHF
- Execution Window: Position held across weeks to months
- Average Win Rate: 60% to 68%
- Primary Advantage: Generates continuous cash flow via rollover interest while holding positions
Pros: Earns overnight interest yields; strong fundamental backing; reduced short-term screen monitoring.
Cons: Vulnerable to sudden geopolitical risk-off events; requires substantial capital account backing.
Risk-to-Reward Ratios (1:2 Min) and Position Sizing Formulas
Position sizing models calculate exact trade volume based on account equity, stop-loss distance, and specific risk tolerance parameters. Maintaining a minimum risk-to-reward ratio of 1:2 ensures long-term system profitability even when overall trade win rates hover around forty or fifty percent.
Risk management forms the core foundation of institutional foreign exchange trading. Without strict position sizing, continuous winning streaks can be wiped out by a single catastrophic losses.
Professional risk management dictates that traders risk no more than one to two percent of total account equity on any individual trade execution. Fixed percentage sizing protects capital during natural losing streaks.
- The risk-to-reward ratio determines the mathematical edge of a trading system.
- Requiring a minimum target of twice the risk distance allows traders to remain profitable with a sub-50% win rate.
Position size calculation relies on exact mathematical formulas. Traders must determine distance to stop-loss in pips and total dollar risk prior to entering the market order.
The mathematical formula for calculating exact position lot size is defined as follows: Position Size (Lots) = (Account Equity x Risk Percentage) / (Stop Loss in Pips x Pip Value per Standard Lot).
| Account Equity | Risk Limit (%) | Risk Amount ($) | Stop Loss (Pips) | Calculated Position Size |
|---|---|---|---|---|
| $10,000 | 1.0% | $100 | 20 Pips | 0.50 Standard Lots |
| $10,000 | 1.0% | $100 | 50 Pips | 0.20 Standard Lots |
| $50,000 | 1.0% | $500 | 25 Pips | 2.00 Standard Lots |
| $100,000 | 0.5% | $500 | 40 Pips | 1.25 Standard Lots |
Backtesting Strategies: Evaluating Win Rates and Profit Factors
Backtesting systematically evaluates trading rules against historical price data to verify statistical edge and expected drawdown parameters. Traders calculate metrics like profit factor, win rate, maximum drawdown, and Sharpe ratio to confirm strategy viability prior to committing live operational capital.
Quantitative backtesting eliminates subjective guesswork from foreign exchange strategy development. Rigorous testing across historical market cycles exposes system performance in trending, ranging, and high-volatility environments.
Manual backtesting involves stepping through historical bar chart data to execute setups according to strict rules. Automated backtesting uses custom programming scripts to execute thousands of historical trades instantly.
- Evaluating trade win rate alone provides an incomplete measure of trading performance.
- A strategy with a thirty percent win rate can be exceptionally profitable if average winning trades exceed average losses by four to one.
Profit Factor represents total gross profits divided by total gross losses across the backtested sample size. A Profit Factor above 1.5 indicates a robust, statistically viable trading setup.
Maximum drawdown measures the maximum peak-to-trough capital decline experienced during testing. Expectancy calculations combine win rate and risk-reward ratios to determine expected dollar return per dollar risked.
Frequently Asked Questions About Forex Strategies
Forex trading strategies require continuous evaluation against changing market volatility regimes, structural liquidity distribution, and macroeconomic conditions. Implementing robust risk management protocols, strict position sizing rules, and disciplined backtesting procedures ensures long-term operational consistency across various currency trading setups.
Which forex strategy is most profitable for beginners?
Daily trend continuation using moving averages offers the highest probability for beginner traders. It reduces screen time, minimizes trade frequency costs, and relies on structural daily market momentum rather than noise.
What is the minimum recommended risk-to-reward ratio in trading?
A minimum risk-to-reward ratio of 1:2 is standard among institutional traders. This structure ensures long-term profitability even if overall trade win rates fluctuate around forty or fifty percent over time.
How many forex trading strategies should a trader execute?
- Traders should master one single trading setup before attempting to execute multiple strategies.
- Specializing in a single setup builds deep pattern recognition across changing market conditions before scaling capital.
Why do most breakout strategies fail during light market volume?
Breakout strategies require high institutional order flow to sustain directional price momentum. During low volume conditions, market makers frequently sweep obvious breakout levels to collect liquidity, producing false breakouts.

Trackbacks/Pingbacks