
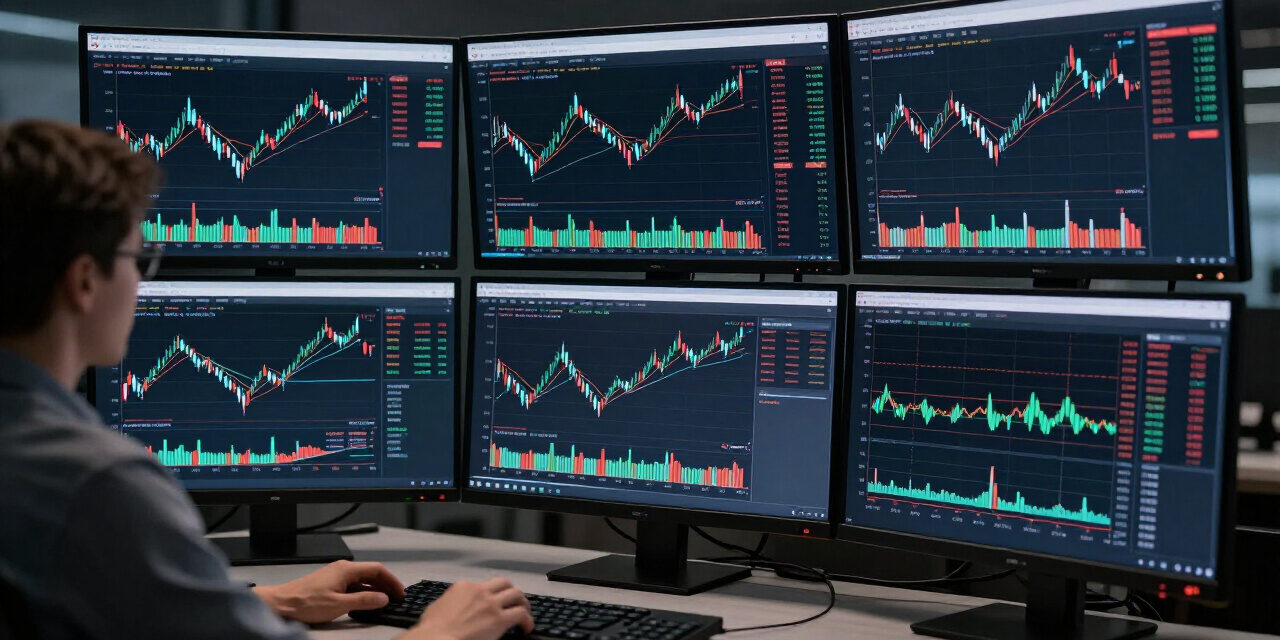
Professional forex trading relies on mastering a complex lexicon where technical indicators and reporting standards intersect. Navigating the market requires precise comprehension of liquidity models like QM, volume weighted average price strategies, and linear regression channels. Traders who fail to differentiate between these sophisticated analytical tools often face significant capital depletion and increased risk exposure during periods of high volatility.
Institutional transparency further complicates this landscape, requiring a robust understanding of financial disclosure frameworks like XBRL. Distinguishing between actionable price action signals and administrative reporting protocols remains the primary separator between retail participants and institutional liquidity providers. This glossary provides the semantic clarity necessary to optimize your technical analysis and improve risk-adjusted returns. Leverage these definitions to refine your entry criteria and align your systematic strategy with the mechanics governing global currency exchanges.
What Is the Quasimodo (QM) Pattern?
The Quasimodo pattern is a reversal formation characterized by a series of four price points that violate previous market structures. It identifies potential trend exhaustion by forcing price to create a higher high followed by a lower low, signaling that institutional participants are trapped and reversing the current price momentum.
Traders often look for the Quasimodo pattern to identify high-probability reversal zones. Unlike standard support and resistance, this formation relies on the psychology of failed market expectations.
When price breaks a previous structural high and then drops below the previous structural low, it creates an imbalance. This imbalance serves as a critical zone for institutional liquidity entry points.
- To master this, many professionals study best forex trading strategies that emphasize price action over lagging indicators.
- You must distinguish between a genuine QM and a standard stop-run maneuver.
The pattern consists of a high, a low, a higher high, and a lower low. The entry typically occurs at the shoulder, which is the original high point before the trend reversal sequence completed its cycle.
Risk management is paramount here. Place your stop-loss above the higher high in a bearish QM, or below the lower low in a bullish QM, to protect against sudden volatility spikes.
Many traders combine the QM pattern with best forex indicators to confirm institutional order blocks. This confirmation reduces the probability of entering into a fakeout during high-impact economic news releases.
Executing this strategy requires patience. You must wait for the price to return to the shoulder level. If the price fails to retest this zone, the pattern is often considered invalidated for the specific session.
Quasimodo Pattern Operational Assessment
The Quasimodo formation provides a structural edge by highlighting liquidity gaps created by retail traders getting trapped at market extremes. It acts as a map for smart money activity, showing where stop-loss orders congregate and where large market participants intend to fill their positions.
Key technical specifications include the need for clear swing points. If the price action is choppy or lacks distinct peaks, the QM pattern loses its reliability. Precision in drawing these levels is essential for accurate entry timing.
Pros: It provides a clear invalidation level for risk control. It exploits institutional supply and demand zones that retail indicators often miss. It offers excellent risk-to-reward ratios when the trade plays out correctly.
Cons: It requires advanced observation skills to identify in real-time. It can produce false signals in highly consolidated markets where liquidity is thin. It demands strict adherence to discipline and pre-set rules.
Volume Weighted Average Price (VWAP) Explained
Volume Weighted Average Price is a trading benchmark that calculates the average price a security has traded at throughout a specific session, based on both volume and price. It provides a more accurate representation of market value than a standard moving average by prioritizing periods of higher institutional activity.
VWAP serves as a primary tool for institutional desks. By measuring the average price relative to total volume, it helps determine if an asset is currently trading at a premium or a discount relative to the day’s true market participation.
When the price resides above the VWAP, it suggests bullish institutional sentiment. Conversely, prices trading below the VWAP often indicate bearish dominance. It is a critical component of institutional execution logic.
- Because retail platforms struggle with true tick-by-tick volume, traders often use this tool in conjunction with best forex indicators.
- It helps filter out noise during periods of low activity.
Intraday traders utilize VWAP to define mean-reversion points. If price deviates significantly from the VWAP, it often acts as a rubber band, pulling the price back toward the average value as institutional participants re-balance their positions.
Integration with best forex trading strategies allows for entry when the price tests the VWAP line after a trend breakout. This provides a confluence of trend direction and volume confirmation for the trader.
VWAP is calculated by summing the products of price and volume for each period, then dividing by the total volume for the specified timeframe. This ensures the output reflects the actual weight of transactions.
Traders must understand that VWAP resets at the start of each trading session. This makes it an exclusively intraday metric that loses its relevance for swing trading or long-term positioning.
VWAP Technical Implementation Guide
Implementing VWAP into your daily routine helps you stay on the side of the market with higher volume. It removes the bias of viewing every price move as equally important and forces you to focus on where the most transactions occurred during the session.
Key technical specifications involve using high-quality data feeds to ensure the volume metrics are representative. Accuracy depends on the broker’s liquidity pool and the quality of the price aggregation service being utilized.
Pros: It provides an objective view of price fairness throughout the day. It acts as a dynamic support or resistance level during trending markets. It is widely respected by algorithms and institutional traders.
Cons: It is limited to intraday timeframes. It can lag significantly in extremely fast markets where price moves rapidly away from the average. It requires access to reliable volume data, which is sometimes elusive in decentralized markets.
Lower Low Higher High (LRLR) Market Structure
Lower Low Higher High describes a specific market phase where price structure violates previous swing points, creating a chaotic environment often associated with range-bound trading. It signifies a lack of directional consensus, where both bears and bulls fail to establish dominance, leading to extended periods of volatility and structural uncertainty.
Recognizing the LRLR structure prevents traders from attempting to trade trends where none exist. In these conditions, price repeatedly sweeps liquidity on both sides of the market without finding a clear path of least resistance.
When you identify this pattern, the best approach is to shift toward best forex trading strategies designed for range-bound markets. Avoid breakouts, as these are often false movements designed to lure retail traders.
- LRLR environments are frustrating.
- Price creates a new lower low to trap sellers, then rapidly shifts to create a new higher high to trap buyers.
- This wipes out stop-losses on both ends of the trading range.
If you find yourself in an LRLR structure, lower your position size significantly. Use best forex indicators like the Relative Strength Index (RSI) to look for overbought or oversold conditions within the range boundaries.
Institutional desks often create this structure intentionally to accumulate or distribute positions while keeping the broader market direction hidden. It serves as a stealthy method for building large orders without moving the price too quickly.
Traders should measure the distance between the recent high and low. If the range is narrowing, the market may be coiling for a major breakout, which provides a trading opportunity once the structural boundaries are finally breached.
Ultimately, the LRLR pattern teaches discipline. It teaches the trader when to step aside and wait for a clear, directional trend to emerge, which is the most profitable time to trade.
Market Structure Structural Analysis
Analyzing structural shifts like the LRLR sequence allows you to adapt your approach to the current liquidity environment. When the market shows these signs, you must prioritize capital preservation over trying to capture volatile price swings that offer low probability of success.
Key technical specifications involve identifying clear pivot points at the extremes of the structure. If the market fails to respect these pivot points, the LRLR model must be discarded in favor of a new structural interpretation.
Pros: It prevents overtrading in non-trending markets. It provides clear boundaries for range-bound trading strategies. It helps identify when the market is preparing for a significant move after a period of consolidation.
Cons: It is highly subjective and depends on the timeframe chosen by the trader. It can lead to paralysis if the trader cannot identify the range boundaries accurately. It produces very low success rates for trend-following systems.
XBRL and Financial Data Reporting Basics
XBRL, or eXtensible Business Reporting Language, is a standardized digital format for communicating financial data. It allows regulatory bodies, investors, and analysts to exchange financial statements across different systems automatically, ensuring transparency and accuracy by tagging data points for machine readability in global capital markets and corporate financial reporting.
In the world of forex, traders often focus on price, but XBRL data impacts the macro conditions driving currency values. When central banks or major corporations file reports in XBRL, the information is processed instantly by high-frequency trading algorithms.
Traders do not interact with XBRL code directly. However, the data derived from these filings feeds into the economic calendars used by every serious participant. Accurate financial reporting directly influences the valuation of the underlying currency pairs.
- Understanding the ecosystem behind financial data helps you appreciate why certain currency pairs move during earnings seasons or central bank reporting dates.
- The speed of data ingestion is vital for market efficiency.
While you use best forex trading strategies to enter the market, remember that fundamental shifts captured in these reports are the root cause of long-term trends. XBRL makes this fundamental data usable for systemic analysis.
Reliable best forex indicators sometimes incorporate fundamental data streams to filter market noise. Having clean, standardized data ensures that the indicators you rely on are based on facts rather than rumors or corrupted data sets.
Financial transparency has improved significantly since the adoption of these reporting languages. It reduces the time between a company or state filing information and the market reacting to that information on a global scale.
Always verify the sources of your fundamental data. While XBRL is a standard, the interpretation of the data by various news outlets can vary. Stick to primary sources whenever possible to maintain an edge in your fundamental analysis.
XBRL Data Infrastructure Assessment
The implementation of digital reporting standards ensures that institutional investors can assess the health of an economy or a firm in real time. For the individual trader, this means that fundamental analysis must be just as fast and accurate as technical analysis to remain competitive.
Key technical specifications include the taxonomy of the data, which defines how financial concepts are tagged. This system eliminates ambiguity and allows for automated cross-referencing of balance sheets, income statements, and cash flow reports across global jurisdictions.
Pros: It eliminates manual data entry errors. It allows for near-instant analysis of corporate performance. It fosters greater transparency in the global financial system, which reduces the potential for market manipulation based on hidden data.
Cons: It is highly technical and requires specialized software for deep analysis. It does not replace the need for critical thinking and human judgment in economic forecasting. It can lead to over-reliance on automated data without context.
Frequently Asked Questions About Forex Technical Terms
This section clarifies common technical queries regarding Quasimodo patterns, VWAP utility, structural analysis, and data reporting standards to ensure traders have a firm grasp of market mechanics. These answers provide insight into how professional participants utilize these concepts to navigate the complexities of global forex and financial markets in 2026.
- How reliable is the Quasimodo pattern for beginners? The pattern requires practice. Beginners often mistake random price action for a QM. It is best learned through backtesting and pairing with trend analysis tools to filter out high-probability setups from simple noise.
- Does VWAP work on all timeframes? VWAP is designed for intraday analysis. While it can be plotted on various timeframes, its mathematical relevance relies on the daily volume cycle. Using it on long-term charts like weekly or monthly intervals lacks standard institutional application.
- Why is market structure analysis critical for trading? Understanding structure prevents you from trading against the current institutional order flow. It helps you identify where the smart money is likely placing orders, which gives you a higher statistical probability of a successful trade entry.
- Do I need to learn XBRL to trade forex? No, you do not need to read XBRL files. However, understanding that global data is processed through such standards helps you recognize why markets move instantly during economic news releases. Focus on the results of the data, not the file format.