

Professional currency traders rely on the double moving average framework to filter market noise and isolate directional bias within volatile price action. By deploying a dual-layered approach, specifically utilizing the 9 EMA and 21 EMA configuration, analysts establish a mechanical protocol for trade execution. This systematic methodology mitigates the risk of false signals often inherent in single-indicator models. Instead of reacting to every tick, the trader waits for the interaction between these two specific averages to signal a change in momentum. This guide provides the institutional-grade technical parameters required to trade the double MA crossover effectively across multiple timeframes during [currentyear]. Success stems from strict adherence to the intersection of trend velocity and exhaustion, turning raw price data into actionable trade setups without relying on subjective indicators.
The double MA strategy functions as a trend-following backbone. It identifies when short-term price momentum shifts relative to the medium-term market equilibrium. When the 9 EMA crosses the 21 EMA, it provides a visual confirmation that the immediate trend is either accelerating or reversing, allowing for precise entry points.
- Explore pairing 9 EMA crossovers with Relative Vigor Index (RVI) oscillator.
- Explore filtering trend expansions in breakout trading strategy guide.
- Explore exploring moving average trends in best indicators for forex trading.
The Mechanics of the 9 EMA and 21 EMA Crossover
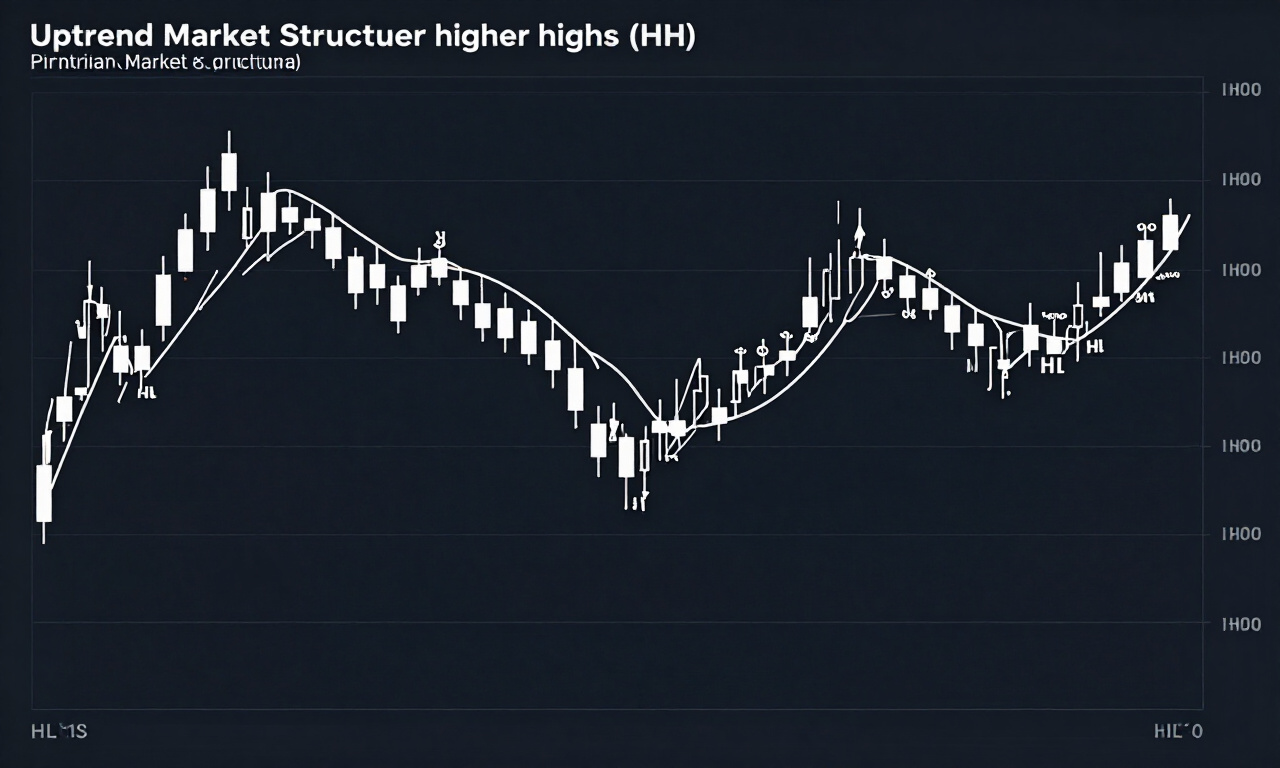
The 9 EMA and 21 EMA crossover acts as a mechanical trigger that identifies momentum shifts by comparing immediate price velocity against a slightly lagged average. When the faster 9 EMA crosses above the 21 EMA, it signals a bullish trend initiation, whereas a downward cross confirms bearish market control.
Traders often struggle with the lag inherent in moving averages. By selecting the 9 and 21 exponential moving averages, we prioritize recent price data. Unlike simple moving averages, these exponential variants react rapidly to sudden volatility spikes, making them ideal for intra-day and swing trading strategies where timing is everything. The gap between these two lines, often termed the ribbon, indicates the strength of the trend. A widening gap shows high momentum, while converging lines suggest the trend is losing steam.
It is vital to understand that the 9 EMA serves as the “fast” signal, while the 21 EMA functions as the “dynamic support or resistance” level. Professional execution requires waiting for the candle to close beyond the crossover point to avoid “fake-outs” during periods of high news-driven volatility.
Practitioner Pro-Tip: Never trade the crossover in isolation. Always verify the cross by observing the price relationship with the 200 EMA to ensure you are not trading against a major institutional trend line.
Establishing Dynamic Support and Resistance Zones
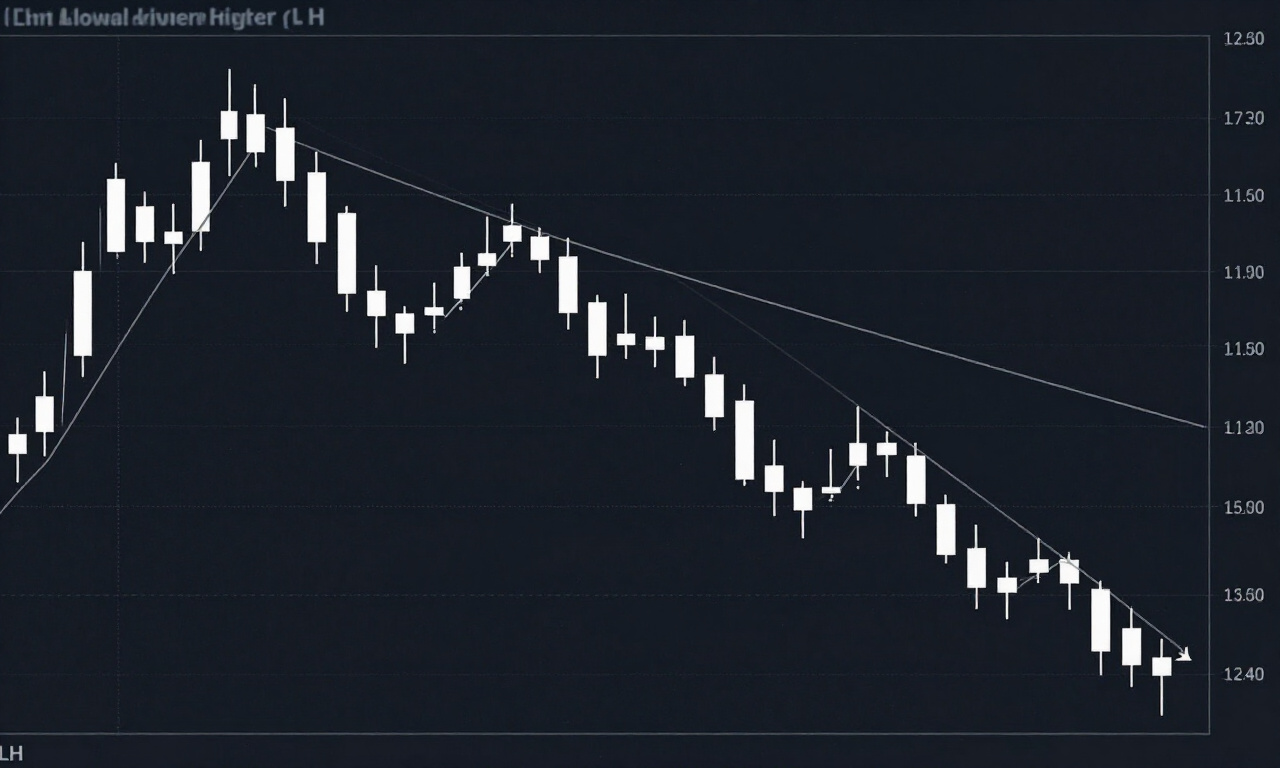
Dynamic support and resistance zones are created by the space between the 9 EMA and 21 EMA, which acts as a shifting floor or ceiling for price action. During trending conditions, price frequently bounces off the 21 EMA after testing the 9 EMA, confirming institutional accumulation or distribution phases.
Most novice traders hunt for horizontal lines drawn on past price peaks. While horizontal levels remain important, the double MA setup provides levels that move with the market. When the 9 EMA is trending above the 21 EMA, the area between them serves as a “buying zone” during minor retracements. Conversely, when the market is trending downward, the same space acts as an “area of interest” for initiating short positions.
- Bullish Zone: Price pulls back to the 21 EMA, the 9 EMA holds above, and a reversal candle forms.
- Bearish Zone: Price rallies to the 21 EMA, the 9 EMA holds below, and a rejection candle appears.
- Congestion Filter: If the 9 EMA and 21 EMA are constantly intertwining, the market lacks a trend and should be avoided.
This dynamic approach allows for a flexible exit strategy. Instead of setting arbitrary targets, you can hold positions as long as the price remains contained within the trending envelope of the double MA configuration. If the price closes on the opposite side of the 21 EMA, it often suggests the trend has been violated and liquidity has shifted.
Entry Filters and Risk Management Protocols
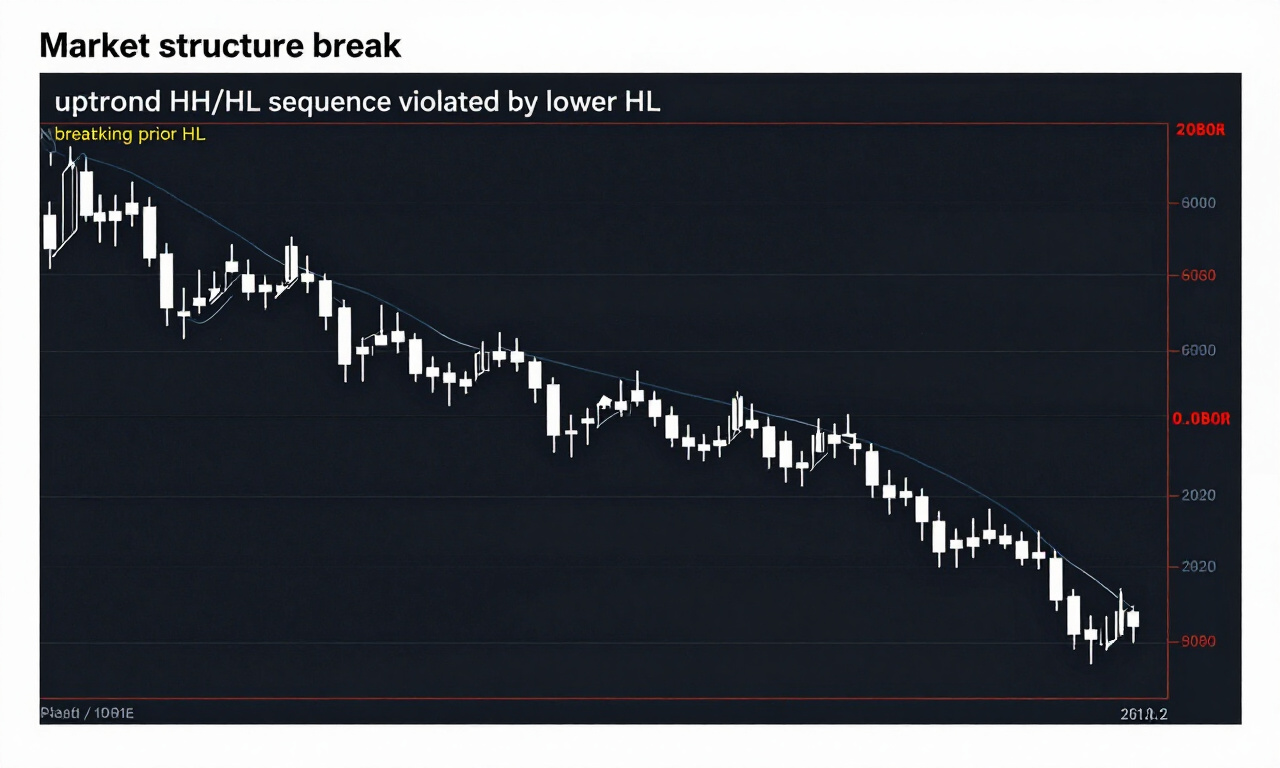
Entry filters are mandatory steps to ensure the double MA signal aligns with broader market context, reducing the likelihood of taking trades during consolidation. By incorporating volume analysis and candlestick patterns alongside the crossover, traders significantly increase the probability of capturing high-conviction moves while minimizing exposure to chop.
A crossover alone is insufficient for a professional trading account. Before pulling the trigger, assess the angle of the moving averages. A steep angle indicates a strong trend, while a horizontal angle confirms a range-bound market where crossovers frequently fail. Use the [forex risk management] principles to set your stops based on the most recent swing high or low, rather than a fixed number of pips.
Consider the “Three-Bar Rule” for entry confirmation. Wait for the cross to occur and then allow for a small retracement to the averages before entering. This prevents buying at the absolute peak of a parabolic move. By entering on the pull-back to the 21 EMA, you improve your risk-to-reward ratio substantially.
Integrating Volume as a Confirmation Tool
Integrating volume analysis with the double MA strategy provides the necessary confirmation that the crossover is backed by institutional market participation. High-volume crossovers signify true shifts in market sentiment, while low-volume crossings are often traps designed to hunt liquidity and cause premature stops for retail traders.
Volume represents the fuel of the market. When the 9 EMA crosses the 21 EMA on a surge of volume, it provides a level of certainty that an institutional flow is occurring. If you observe a crossover on low volume during the session, the probability of a reversal is extremely high. Use this to your advantage by avoiding trades that lack the necessary volume profile to sustain a trend.
Market makers thrive on retail traders who react to every signal regardless of the underlying volume. By setting a volume filter, you effectively ignore the noise. You can pair this with [technical chart patterns] to see if the breakout aligns with the MA signals. If the market is hitting a major resistance level at the same time a volume-backed crossover occurs, the setup becomes a high-probability trade worth larger position sizes.
Trading the 9 EMA and 21 EMA on the H4 Timeframe
Trading the 9 EMA and 21 EMA on the H4 timeframe offers a balance between noise reduction and trade frequency, capturing significant swing moves while avoiding the erratic behavior of lower timeframes. This timeframe provides stable trends that remain consistent across the European and American trading sessions for intraday consistency.
The four-hour chart is widely regarded as the gold standard for trend following. On this timeframe, the 9 EMA and 21 EMA interact with the weekly trend, providing a reliable map of where the smart money is heading. Traders focusing on this timeframe often hold positions for several days, allowing for larger profit potential compared to M15 or M30 scalping.
When executing on H4, focus on the London market open to identify the initial direction. If the 9 EMA crosses above the 21 EMA during the early hours of the session, look for a retest of the crossover zone during the mid-day dip. This is a classic “continuation trade” that leverages the institutional momentum established early in the day. Keep your risk manageable by placing stops just beneath the 21 EMA, which serves as a hard line of defense for the current trend.
Advanced Exit Strategies for Maximum Profit
Advanced exit strategies for the double MA model involve trailing stops based on the 21 EMA slope, allowing for a systematic capture of the trend while locking in realized gains. This prevents the emotional error of closing a winning trade too early while ensuring protection against sudden reversals that wipe out profits.
Most traders are excellent at identifying entries but lack a concrete plan for exiting. With the double MA, the exit becomes a binary choice. If the price closes on the opposite side of the 21 EMA, you must exit the position regardless of your personal sentiment. This removes the “hope factor” from your trading desk.
In addition to the closing criteria, use a “Multiple Take Profit” structure. Close 50 percent of the position once a 1:2 risk-to-reward ratio is hit, and allow the remaining half to run until a crossover occurs. This ensures that you have secured capital while still participating in the extended run of the trend. Always monitor the slope of the 21 EMA; if it starts to flatten out, the trend is exhausted, and you should consider taking full profits early.
Common Pitfalls in Double MA Execution
Common pitfalls in double MA execution include over-trading during sideways market conditions and ignoring the impact of fundamental news events. Traders often fail by applying this trend-following tool during range-bound sessions, resulting in a series of small, avoidable losses that erode trading capital and psychological capital over time.
The market spends nearly 70 percent of its time in a range. The double MA strategy is not designed for these periods. If you notice the 9 EMA and 21 EMA moving horizontally, stop trading immediately. This is a clear indicator that the market is searching for direction and that a crossover will likely result in a whipsaw event.
Furthermore, avoid trading during high-impact news releases such as Non-Farm Payrolls or central bank announcements. The volatility during these times often causes both the 9 EMA and 21 EMA to stretch aggressively, providing false crossover signals. Wait for the market to stabilize at least 30 minutes after major data releases before re-engaging with your technical strategy.
Frequently Asked Questions
What is the best timeframe to use the 9 and 21 EMA strategy?
The H4 timeframe is generally considered the most reliable for trend identification, while the M15 timeframe is preferred for day traders looking for quicker execution cycles.
Does the 9/21 EMA strategy work on crypto assets?
Yes, this strategy is highly effective on volatile instruments like cryptocurrencies, provided you account for the wider spreads and faster momentum swings common in those specific digital markets.
Should I use Simple Moving Averages instead of Exponential?
Exponential moving averages are preferred because they give more weight to recent prices, allowing the trader to react faster to sudden shifts, which is essential in professional trading.
How can I avoid getting trapped in a “fake-out”?
Always wait for the candle following the crossover to close clearly in the direction of the trend, and ensure the volume supports the move.