
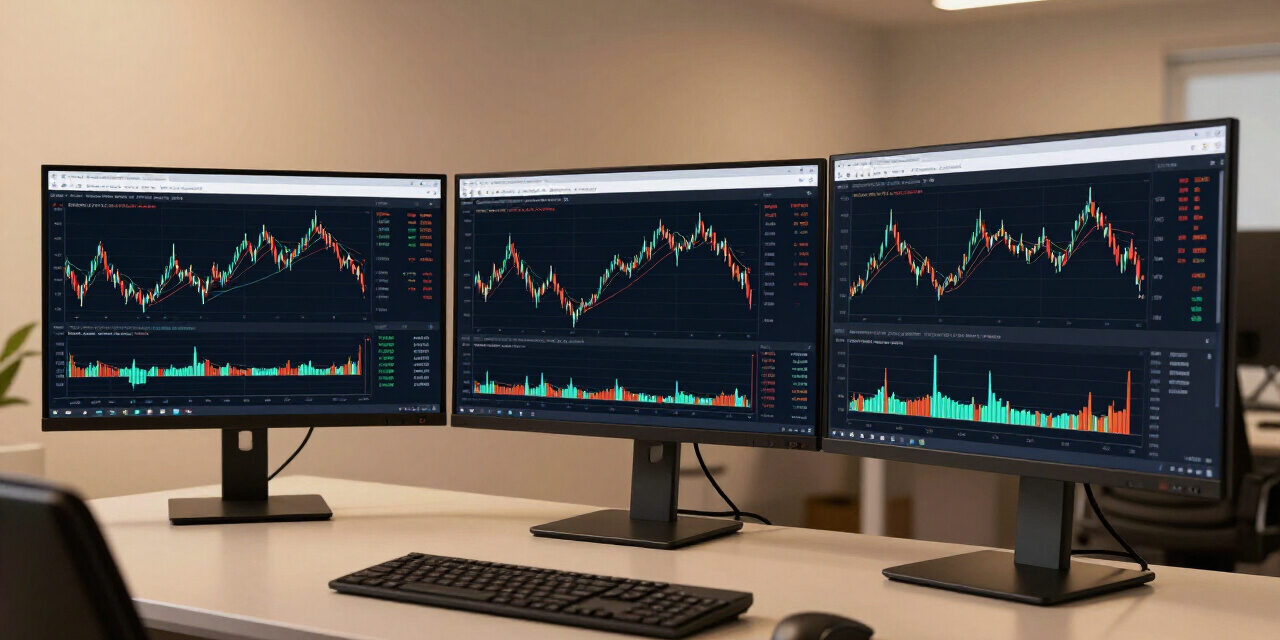
The Relative Vigor Index, commonly abbreviated as RVI, stands as a sophisticated momentum oscillator designed to measure the conviction behind price movements. Unlike traditional indicators that focus purely on closing prices, the RVI accounts for the relationship between the closing price and the opening price of a security. This mechanism provides a nuanced view of market sentiment, helping traders identify the strength of a trend and potential reversal points in volatile conditions during October 2026.
By assessing how prices finish relative to their opening range, the indicator effectively filters out market noise that often traps retail traders in false breakouts. Whether you are scalping short-term volatility or holding swing positions, understanding the mathematical foundation and signal dynamics of the Relative Vigor Index is essential for building a robust technical analysis toolkit that remains reliable across changing market cycles.
- Explore combining RVI oscillator signals with the Traders Dynamic Index (TDI) indicator.
- Explore filtering trend direction via the double moving average 9 EMA strategy.
- Explore analyzing momentum tools in best indicators for forex trading.
Understanding the Relative Vigor Index Formula
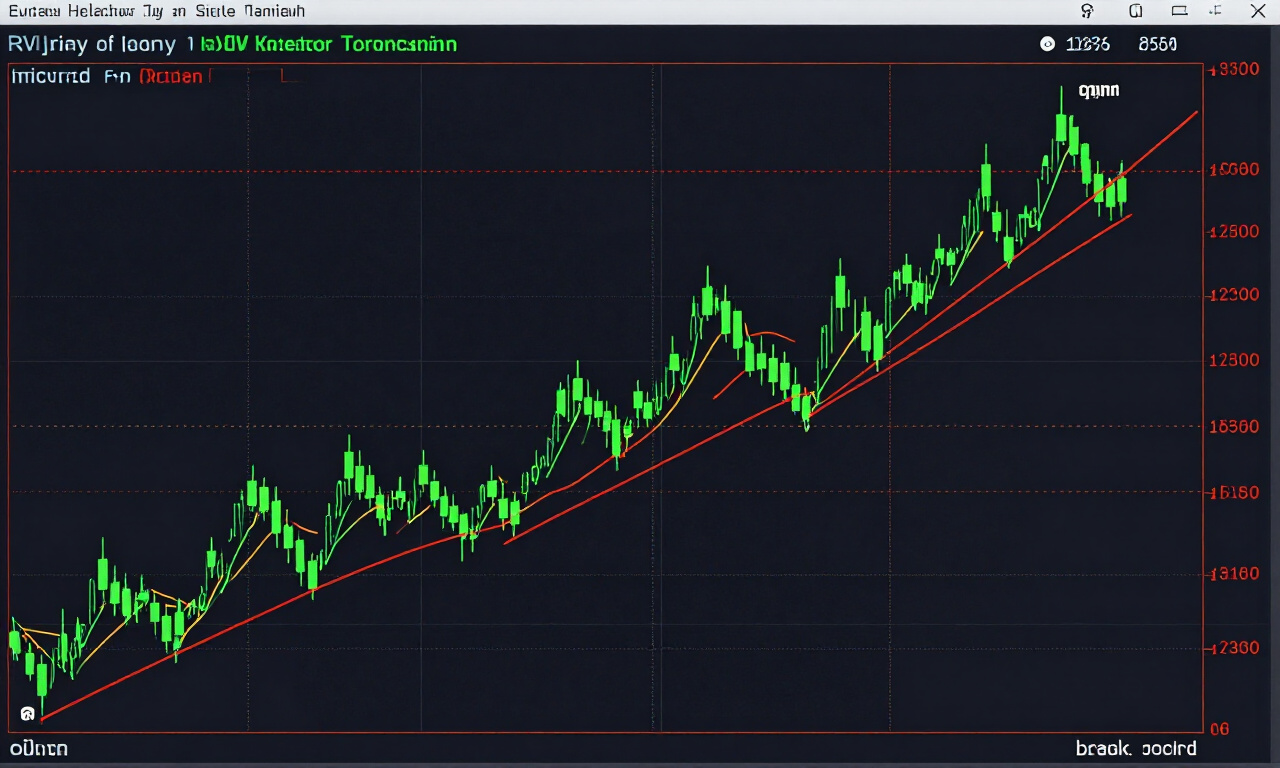
The Relative Vigor Index calculation measures the strength of a trend by comparing the difference between closing and opening prices to the total range of the trading period. It utilizes a four-period simple moving average of these price changes, normalized by the range, to produce a smoothed, responsive oscillator signal.
To grasp the logic, one must visualize the relationship between the close and the open as the primary driver of market energy. When prices close higher than they open, the RVI indicates positive vigor, suggesting that buyers retain control of the price action. Conversely, a close lower than the open signals negative energy, reflecting bearish pressure.
The mathematical computation follows these steps:
- Calculate the difference between the close and open (Close – Open).
- Calculate the difference between the high and low (High – Low).
- Sum these values over a four-period lookback window.
- Divide the sum of the numerator (Close-Open) by the sum of the denominator (High-Low).
- Apply a weighted moving average to smooth the output for signal stability.
This approach ensures the indicator captures the “vigor” or intensity of price action. By focusing on the closing position within the bar, it distinguishes between healthy trends and those losing steam.
Practitioner Pro-Tip: Always look at the RVI in context with the volume profile. If the RVI shows high vigor but volume is contracting, the move is often a fake-out that will reverse within the next few candles.
Interpreting RVI Signal Line Crossovers
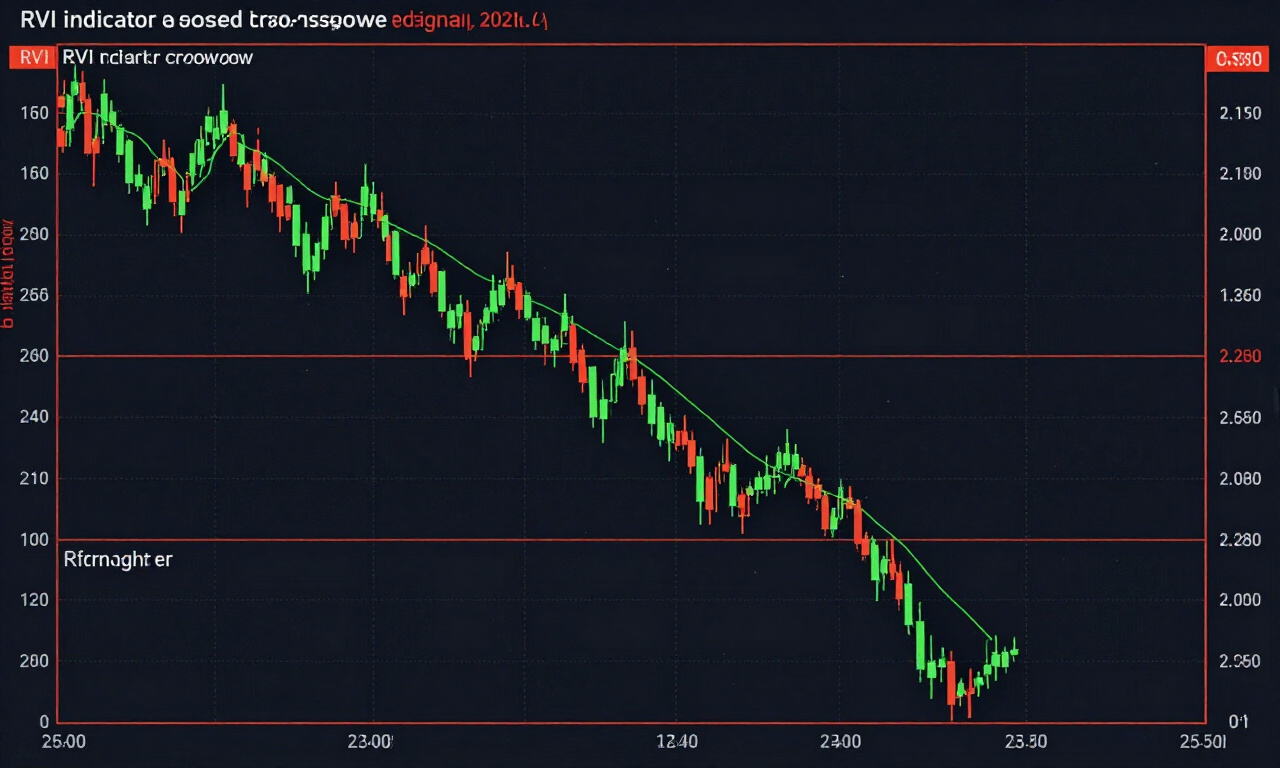
Signal line crossovers occur when the primary RVI line intersects its own calculated trigger line, providing clear entry points. A bullish signal emerges when the RVI line crosses above the signal line, while a bearish signal is confirmed when the RVI drops below the signal line during an active trend.
These crossovers serve as the standard entry mechanism for many mechanical systems. When the market is trending, these intersections capture the momentum shift effectively. However, during sideways consolidation, these crossovers tend to produce whipsaws. To combat this, experienced traders often wait for the crossover to occur outside of the neutral zone, near the extreme levels of the oscillator.
Refining your entry timing requires observation of the angle of the crossover. A steep angle indicates a sudden, high-conviction shift in market sentiment. A shallow, slow crossover often suggests that the trend is grinding rather than surging. For those focusing on 2026 market volatility, identifying the sharpest crosses often yields the best risk-to-reward ratios.
Consider these guidelines for crossover execution:
- Wait for the candle to close before confirming the cross to avoid indicator repainting.
- Look for a divergence between the price slope and the crossover angle.
- Ensure the crossover aligns with the broader market direction indicated by a 200-period moving average.
Divergence Trading with the RVI
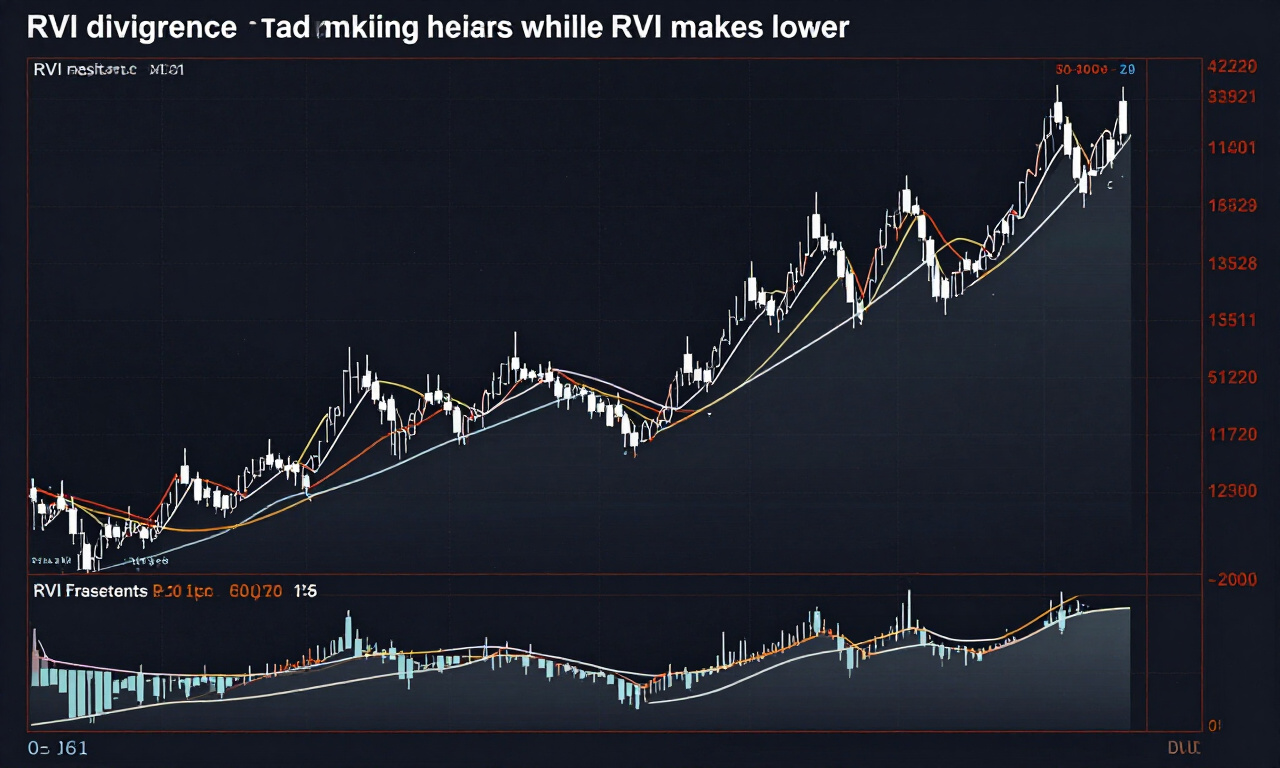
Divergence trading with the Relative Vigor Index identifies instances where price reaches a new high or low, but the indicator fails to mirror that extreme. This decoupling indicates a loss of momentum, signaling that the prevailing trend is nearing exhaustion and a reversal or correction is likely imminent.
This is perhaps the most powerful application of the indicator. When price makes a higher high, but the RVI makes a lower high, you have identified a classic bearish divergence. This implies that while the price is pushed higher, the underlying “vigor” or buying intensity is diminishing. This is a red flag for trend-followers.
Conversely, bullish divergence occurs when the price records a lower low, but the RVI records a higher low. This indicates that despite the new price low, the downward pressure is losing strength. Often, this precedes a significant rally or trend reversal. For traders utilizing advanced forex trading strategies, divergence acts as an early warning system.
To master divergence, keep these parameters in mind:
- Regular Divergence: Signals potential trend reversals.
- Hidden Divergence: Used to identify trend continuation points during pullbacks.
- Timeframe Correlation: Divergences on higher timeframes like the 4H or Daily hold significantly more weight than those on the 5-minute charts.
Pairing RVI with Moving Averages
Pairing the Relative Vigor Index with moving averages creates a dual-layer confirmation system that filters out noise. By requiring a moving average to confirm the general trend direction, traders can avoid counter-trend trades where the RVI might temporarily signal a reversal that lacks sufficient support from the broader market.
A popular approach involves the 50-day and 200-day simple moving averages. When the price sits above the 200-day average, you only execute “buy” signals generated by the RVI. When the price sits below, you focus exclusively on “sell” signals. This simple rule prevents traders from fighting the primary trend of the instrument.
The interaction between the RVI and a shorter-term moving average, such as a 20-period EMA, can also highlight the health of a current micro-trend. If the price remains above the 20-period EMA while the RVI stays above the zero line, the trend is considered healthy and aggressive. Any dips toward the zero line during this phase are often viewed as buying opportunities rather than reversals.
Integrating these tools allows for a cleaner execution plan:
- Trend Filter: Use the 200-period EMA to define the high-level trend bias.
- Trigger: Use the RVI crossover for the specific point of entry.
- Management: Trail stops based on the slope of the moving average.
Evaluating the 10-Period RVI Setting
The 10-period setting is widely considered the industry standard for the Relative Vigor Index. It provides an optimal balance between sensitivity to immediate price fluctuations and the smoothness required to prevent excessive false signals, making it suitable for both intraday scalping and swing trading across most major currency pairs.
Choosing the right timeframe for the RVI depends entirely on your specific trading style. A shorter period, such as 5, makes the indicator highly reactive. While this catches moves quickly, it results in high volatility and numerous false crossovers. Conversely, a period setting above 20 creates a very smooth curve that may lag significantly behind major price shifts.
In October 2026, the standard 10-period setting continues to perform exceptionally well on the H1 and H4 charts. For traders, this setting offers a reliable threshold to judge if a market is truly overextended. If the RVI reading exceeds typical values for a 10-period window, it often suggests that the price movement is over-extended and due for a mean reversion.
Pros of the 10-period setting include:
- Standardized usage allows for easier backtesting against historical data.
- High compatibility with common price action formations like flags and triangles.
- Provides a clear “zero line” reference point that traders find intuitive for momentum assessment.
Cons include:
- Can still be susceptible to “choppy” signals in extremely flat market conditions.
- Requires a secondary indicator or filter to avoid taking trades in range-bound markets.
Customizing RVI for Swing Trading
Customizing the Relative Vigor Index for swing trading typically involves increasing the lookback period to 20 or higher. This adjustment reduces the frequency of signals, ensuring that the trades taken have a higher probability of following a sustained trend rather than responding to short-term market noise or intra-day volatility.
Swing traders look for the “meat” of the move. They do not mind missing the first few pips of a trend if it means avoiding the frequent traps set by day traders. By extending the RVI period to 20, you align the indicator with the longer-term sentiment cycles. This adjustment makes the zero-line crossovers much more meaningful.
When the RVI stays above the zero line for a prolonged period, it confirms a healthy swing trend. Any “pullback” that sees the RVI move toward the zero line—without actually crossing it—is a classic sign that the trend is preparing to resume. This is an excellent way to add to existing positions during a swing trade.
Swing trading optimization checklist:
- Use Daily or Weekly charts to define the primary bias.
- Set the RVI to 20 periods for a more stable signal.
- Only enter when the RVI signal line completes a reversal from the extreme high or low zones.
- Maintain positions until the RVI signal line crosses back to the opposite side of the zero line.
Optimizing RVI for Scalping Strategies
Optimizing the Relative Vigor Index for scalping requires setting the indicator to a shorter lookback window, typically between 5 and 7 periods. This sensitivity allows the scalper to capture rapid price oscillations and momentum spikes, enabling quick entries and exits that exploit micro-trends within highly liquid market environments.
Scalpers must prioritize speed and indicator reactivity. In an environment like the 1-minute or 5-minute chart, a 10-period RVI often reacts too slowly to the price movement. By tightening the period, you allow the RVI to reflect the immediate urgency of buyers and sellers within the last few minutes of trading.
However, the trade-off for this speed is a higher frequency of false signals. Scalpers must use strict stop-loss levels and perhaps pair the RVI with a secondary oscillator like the Stochastics or RSI to confirm the setup. If both indicators reach an extreme zone and then trigger a crossover, the confidence in the scalp trade increases significantly.
Key requirements for scalping with RVI:
- Execute only during high-volume sessions, such as the London/New York overlap.
- Use a 5-period setting to capture maximum sensitivity.
- Exit the trade as soon as the signal line loses its steep angle.
- Avoid trading during news events where volatility can render technical indicators erratic and unreliable.
Frequently Asked Questions
This section provides answers to the most common queries regarding the Relative Vigor Index. Whether you are seeking clarification on its core functionality, setting adjustments, or how it differs from other momentum oscillators, these answers will clarify your approach to utilizing the RVI in your own trading endeavors throughout the year.
- How does the RVI differ from the RSI? Unlike the Relative Strength Index (RSI) which measures speed of price change, the RVI focuses on the position of the close relative to the open. This makes it a more effective tool for identifying the “vigor” or intent behind a move, whereas RSI is more about overbought/oversold status.
- Can the RVI be used on all asset classes? Yes, the RVI is highly effective across forex, indices, and commodities. Because its formula is based on price action and volatility rather than specific volume data that may be absent in decentralized markets, it remains a consistent indicator regardless of the traded instrument.
- What is the best way to avoid false signals with the RVI? The best method is to use the RVI as a secondary indicator. Pair it with a long-term trend indicator like the 200 EMA. Only trade in the direction of the long-term trend, and use the RVI crossover as your specific entry trigger.
- Does the RVI work in range-bound markets? The RVI is essentially a trend-following tool. In a tight range, it will generate frequent, unreliable crossovers. During these times, it is better to turn off trend-following signals and look for divergence signals to trade the boundaries of the range rather than trend breakouts.