
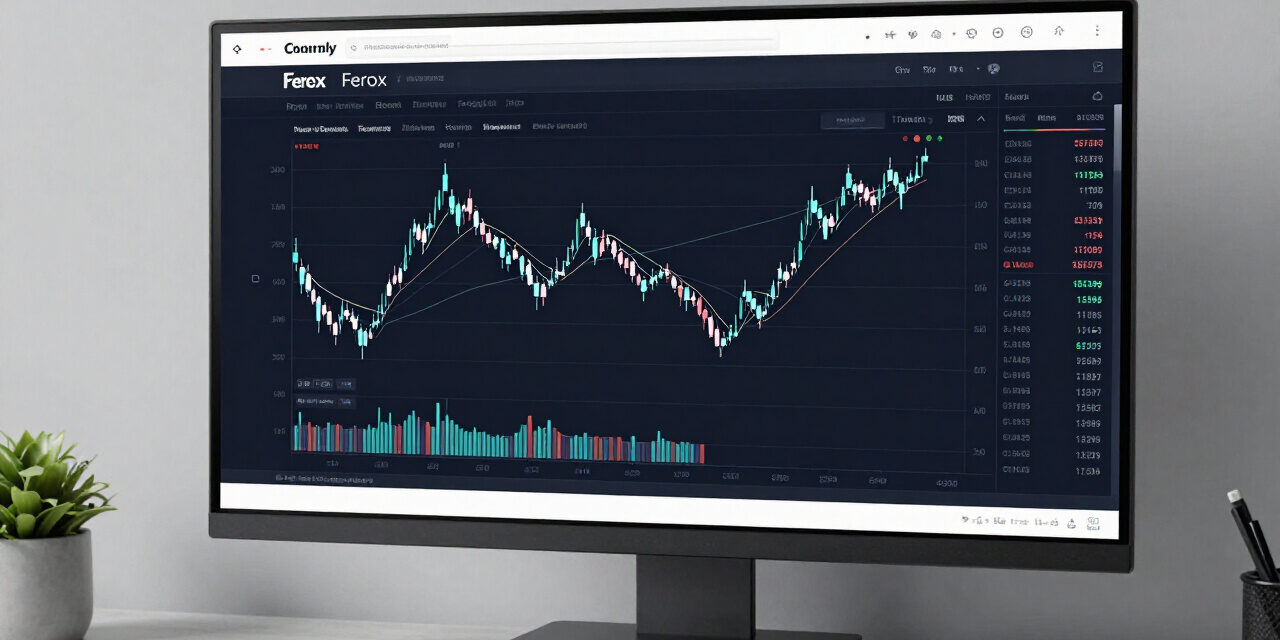
The Strat trading method, developed by market veteran Rob Smith, provides a systematic framework for price action analysis. By categorizing price movement into specific candle formations, traders eliminate subjective interpretation of market noise. This technical approach relies on the sequence of 1, 2, and 3 bars to determine market direction, potential reversals, and areas of exhaustion across multiple time frames.
Successful execution requires a strict adherence to time frame continuity and the recognition of specific patterns such as the inside bar (1), the directional bar (2), and the outside bar (3). Rather than relying on lagging indicators or complex oscillators, practitioners of the Strat focus on pure price action. This guide breaks down the core mechanics of the Strat, offering an objective look at how professional traders navigate intraday and swing market fluctuations in [currentmonth] [currentyear].
- Explore analyzing price rejection bars in pin bar & doji candlestick strategy.
- Explore identifying multi-timeframe continuity in higher highs & lower lows market structure.
- Explore executing 2-2 breakout continuations in breakout trading strategy guide.
Understanding The Strat Trading Methodology
The Strat trading method is a rule-based price action system that classifies every candle on a chart into one of three numerical types: a 1-bar representing an inside candle, a 2-bar representing a directional move, and a 3-bar representing an outside candle to define momentum, reversal, and consolidation phases effectively.
At its core, the Strat operates on the principle that the market is a series of candles that have a defined relationship with the previous candle. By identifying whether a bar is a 1, 2, or 3, traders can determine if the market is resting, expanding, or reversing. This removes the guess-work often associated with retail trading patterns.
The primary utility of this system is its ability to be applied to any timeframe. Whether you are analyzing a 5-minute chart for scalping or a weekly chart for long-term positioning, the classification remains identical. Practitioners often look for “time frame continuity,” where the lower timeframe aligns with the dominant move on the higher timeframe. This alignment acts as a tailwind, significantly increasing the probability of a successful trade.
Practitioner Pro-Tip: The most significant setups often occur when the monthly, weekly, and daily timeframes all exhibit the same directional bias. When a 2-up bar on a higher timeframe aligns with a 2-up move on a lower timeframe, the institutional money flow is typically behind the move.
The 1-Inside Bar Formation
A 1-bar in the Strat system is characterized as an inside candle, where the high and low of the current bar are entirely contained within the high and low of the previous candle. This structure signals a consolidation phase, representing a period of market indecision and energy accumulation before breakout.
The 1-bar is essentially a compression zone. Traders wait for the market to resolve this compression by observing which side the price breaks first. If price breaks above the high of the 1-bar, it signals an upward move. Conversely, if it breaks the low, a downward move is initiated. This pattern is frequently utilized to identify the start of significant trend continuations.
Many professional traders look for a 1-2 reversal or a 1-2 continuation. A 1-2 reversal occurs when an inside bar (1) is followed by a directional bar (2) in the opposite direction of the preceding move. Identifying these patterns allows the trader to place tight stop losses just beyond the high or low of the inside bar, providing an excellent risk-to-reward ratio.
Executing the 1-2 Continuation Pattern
The 1-2 continuation pattern occurs when an inside bar is followed by a directional bar that breaks in the direction of the trend, confirming that the consolidation phase has resolved in favor of the existing market momentum, allowing for entry upon the breakout of the candle’s range.
When you spot an inside bar, you are looking at market compression. The market is essentially coiling. A 1-2 continuation is one of the highest-probability setups for those focused on momentum. Once the market breaches the range of the inside bar, the sudden influx of stop-loss orders from participants on the other side of the trade often creates a swift move in your direction.
To execute this, set your buy stop slightly above the high of the 1-bar if you are looking for a long position. If the price triggers the order, you are in. Your initial stop loss should be placed below the low of the 1-bar. If the price fails to break out and moves in the opposite direction, the 1-bar invalidates, and you exit the position with minimal loss.
- Identify the 1-bar: Ensure the current candle high is lower than the previous high and the current low is higher than the previous low.
- Define the trigger: The trigger level is the high or low of the 1-bar.
- Risk management: Place the stop at the opposite end of the 1-bar range.
- Timeframe verification: Ensure the higher timeframe supports the direction of your breakout.
The 2-Directional Bar Formation
A 2-bar is defined as a directional bar that takes out either the high or the low of the previous bar, but not both, serving as the primary indicator of trending momentum where traders capitalize on the sustained movement in a specific market direction across various liquid assets.
The 2-bar is the engine of the market. It shows that buyers or sellers are in control. A 2-up bar takes out the previous high, while a 2-down bar takes out the previous low. Understanding the 2-bar is essential for identifying when a trend is active and when it is potentially nearing exhaustion.
When you see a series of 2-up bars, you have a clear uptrend. However, the Strat also teaches traders to watch for the “2-2 reversal.” This occurs when a 2-up bar is immediately followed by a 2-down bar, taking out the low of the 2-up bar. This is a powerful reversal signal that indicates a shift in market sentiment from bullish to bearish.
Trading the 2-2 Reversal Setup
The 2-2 reversal setup functions as a primary reversal signal in the Strat methodology, triggered when a 2-up bar is immediately followed by a 2-down bar that clears the prior bar’s low, signaling that buyers have been overwhelmed by aggressive selling pressure at a potential resistance level.
This setup is particularly effective when it occurs at a multi-month high or after a significant move in one direction. By observing the failure of the 2-up bar, you can time your entry for the reversal. The 2-2 reversal provides a clear, objective entry point that requires very little subjective interpretation. If the high of the 2-up bar is not violated, the bearish setup remains valid.
Practitioners often wait for the 2-2 reversal to confirm on a specific timeframe, such as the hourly chart, before committing capital. The risk is defined by the high of the 2-up bar, which acts as the ultimate invalidation point. If the price moves above that high, the reversal setup is considered failed, and the trader should close the position.
- Monitor for exhaustion: Look for the 2-2 reversal at known support or resistance levels.
- Entry precision: Enter on the breach of the 2-down bar’s low.
- Stop loss placement: Position the stop at the high of the 2-up bar.
- Scale out: Consider taking partial profits at the next level of support or when a 2-up bar forms in the opposite direction.
The 3-Outside Bar Formation
A 3-bar, or outside bar, is a formation where the current candle takes out both the high and the low of the previous candle, indicating a massive expansion of volatility and a battle for control between buyers and sellers that often marks a significant market inflection point.
The 3-bar represents peak volatility. Because it breaches both extremes of the prior candle, it often traps traders who were positioned on the wrong side. When a 3-bar occurs, the market is signaling that it has moved beyond the range of the previous period and is likely to continue in the direction of the breakout.
Trading the 3-bar requires caution because the stop loss is inherently wider than a 2-bar. However, the potential for a move is also greater. Many traders prefer to wait for the 3-bar to close and then trade the subsequent candle as a 2-bar continuation. This allows for a more controlled entry with a clearer understanding of the prevailing momentum.
Mastering 3-Bar Volatility Breakouts
3-bar volatility breakouts occur when the market expands beyond the range of the prior candle, creating an outside bar that signals institutional participation; traders look for a 2-bar follow-through on the next period to confirm the direction and minimize exposure to false breakouts in the market.
The key to trading 3-bars is waiting for the confirmation. An outside bar can sometimes lead to a “whipsaw,” where the market breaks one way, fails, and then reverses. By waiting for the following candle to act as a 2-bar, you ensure that the market has chosen a definitive path. This approach reduces the probability of getting stopped out by initial volatility spikes.
When you spot a 3-bar, check your higher timeframes. Is the 3-bar occurring in the direction of the overall trend? If yes, the probability of a sustained move is significantly higher. If the 3-bar occurs against the trend, it may be a sign of exhaustion, and you should look for a potential reversal setup instead of a continuation play.
- Assess the range: Confirm the candle is indeed a 3-bar by checking it encompasses both the previous high and low.
- Wait for follow-through: Use the next candle as a 2-bar confirmation.
- Manage volatility: Ensure your position size reflects the wider range of the 3-bar.
- Targeting: Use previous levels of resistance or support as exit objectives.
Time Frame Continuity Explained
Time frame continuity in the Strat is the alignment of price action across multiple timeframes, where the current candle on the daily, weekly, and monthly charts all move in the same direction, providing a high-conviction environment for trade setups and indicating strong institutional market participation.
When you have daily, weekly, and monthly timeframes all showing a 2-up progression, you have full time frame continuity. This is the “holy grail” for many trend-following traders. It means that market participants across all durations are buying, creating a powerful momentum flow that is difficult to stop.
Conversely, when timeframes are not aligned, the market is likely in a period of transition or consolidation. Trading against a lack of continuity is often a recipe for frustration. By restricting your trades to times when at least two or three timeframes are in sync, you naturally filter out low-quality signals and focus on trades with higher probability.
To implement this, you must have your charts organized. Many traders keep a multi-pane view where the monthly, weekly, and daily charts are visible simultaneously. When the daily setup aligns with the weekly and monthly bias, you have the necessary confirmation to initiate a position with confidence, knowing the tide is in your favor.
Practitioner Pro-Tip: Don’t force a trade if the timeframes are in conflict. A 2-down move on a daily chart against a 2-up move on a monthly chart often results in a “dead-end” trade where momentum stalls quickly. Patience is the ultimate filter in the Strat system.
Developing a Strat Trading Routine
A consistent Strat trading routine requires a systematic scan of asset classes across multiple timeframes, identifying 1, 2, and 3-bar formations, checking for time frame continuity, and preparing entry orders at predetermined levels to remove emotional decision-making from the execution of the trade plan during market hours.
Every morning, before the market opens, successful traders spend time identifying key setups on higher timeframes. By noting where the weekly and monthly bars closed, you establish your bias for the week. This preparation ensures that you are not reacting to market noise, but executing a plan developed when the market was closed.
During the session, the focus shifts to monitoring these pre-identified levels. If a price triggers a setup on your watchlist, the execution is automatic. There is no debating the validity of the trade. If the price moves past the trigger, you enter. If it fails, you don’t. This mechanical approach is what separates long-term successful traders from those who struggle with psychological barriers.
Finally, your routine must include a post-market review. Analyze the trades you took and, more importantly, the trades you missed. Did the 1-2 continuation perform as expected? Was the 2-2 reversal at the support level valid? Constant review of your execution against the Strat rules is the only way to refine your edge and increase your consistency over time.
Frequently Asked Questions
The Frequently Asked Questions section addresses common inquiries regarding the Strat trading methodology, including how to handle false breakouts, the importance of time frame alignment, identifying valid 1-2-3 patterns, and best practices for managing risk during periods of high market volatility using the Rob Smith framework.
- What is the most reliable Strat pattern for beginners? The 1-2 continuation is generally considered the most reliable for those new to the system, as it relies on the resolution of a clear, visual compression zone.
- How do I handle a failed trade in the Strat? If a setup fails, immediately exit at the predetermined invalidation level; in the Strat, there is no “holding and hoping” if the rules of the formation are violated.
- Does the Strat work on all asset classes? Yes, the system is based on price action and works effectively on forex, stocks, futures, and cryptocurrencies because these markets all follow the same underlying supply and demand dynamics.
- Why is time frame continuity so important? It acts as a filter that aligns your trades with the larger market flow, significantly increasing the probability of a sustained price move and reducing the impact of counter-trend noise.