

Market structure serves as the foundational bedrock for any professional trading methodology. By tracking the sequence of higher highs and higher lows, traders gain an objective lens to determine whether a financial instrument resides within an institutional distribution phase, an accumulation cycle, or a trending expansion. Price action is rarely random; it follows the footprints of liquidity providers who dictate price direction through specific structural pivots. Understanding how these pivots form, sustain, and eventually break is the difference between consistent market participation and reactionary gambling. This guide dissects the mechanics of trend identification, providing a rigorous framework for mapping structural points across multiple timeframes. Mastery of these patterns allows for precise entry timing and disciplined risk management, ensuring that every position aligns with the dominant market momentum rather than against it.
Trend identification requires a systematic approach to price action, moving beyond indicators to analyze the raw behavior of candles. When we observe market structure, we prioritize the integrity of swing points. A swing high is defined by a peak flanked by two lower highs, while a swing low features a trough flanked by two higher lows. By connecting these points, the trader identifies the structural bias of the current timeframe, effectively mapping the path of least resistance. This clarity prevents the common pitfall of attempting to catch reversals in a strong directional trend, which often leads to significant capital erosion.
- Explore trading structural breaks in breakout trading strategy guide.
- Explore evaluating market structure shifts in complete ICT trading strategy guide.
- Explore identifying equilibrium points in mean reversion trading strategy.
Understanding Higher Highs and Higher Lows in Trend Mapping
A bullish market structure is defined by the consistent formation of higher highs and higher lows. This sequence indicates that buyers maintain control, consistently pushing price above previous resistance levels while preventing sellers from driving the price below the most recent support pivot established during the previous impulse move.
In a healthy uptrend, the market does not move in a straight line. It progresses through impulsive waves and corrective phases. An impulsive leg terminates at a new high, and the subsequent pullback finds support at a level higher than the previous low. This creates the higher high and higher low sequence. If the price fails to make a higher high, the trend loses its primary momentum.
When the price fails to sustain a higher low and breaks below the previous structural support, the bullish market structure is considered compromised. Traders categorize this event as a structural break. Many retail participants mistake a minor dip for a trend reversal, but professional analysis demands a confirmed break of the lowest support point in the sequence.
Practitioner Pro-Tip: Never trade against the current structural trend unless you have a confirmed breakdown of the last confirmed pivot point. Always wait for the price to show weakness by failing to create a new high before considering a short position.
The Mechanics of Lower Highs and Lower Lows
A bearish market structure is confirmed by a consistent sequence of lower highs and lower lows. Each new impulsive push fails to reach the peak of the previous rally, while every corrective bounce fails to hold above the previous support, resulting in sustained downward price pressure throughout the session.
The bear trend operates on the same logic as the bull trend but inverted. Institutional sellers initiate short positions during the corrective phases, known as lower highs. These points are critical for trend following. If a trader can identify a lower high early, they position themselves to profit from the next leg downward, which is usually the fastest phase of the move.
Identifying the lower low is just as vital for risk management. A lower low confirms that supply remains heavy and that demand is insufficient to absorb current sell orders. When trading within a bearish structure, the objective is to sell at the lower high and target the next expected lower low. This keeps the trade aligned with the prevailing institutional trend.
- Impulse phase: High velocity, trend-aligned movement.
- Correction phase: Lower volatility, retesting previous broken structure.
- Structural failure: Price closes above the most recent lower high, signaling a potential shift to bullishness.
Identifying Structural Breaks (BOS)
A Break of Structure (BOS) occurs when price momentum forces a candle close beyond the most recent swing high or swing low. This event validates the continuation of an existing trend and serves as an institutional signal that the market is prepared to expand into the next liquidity zone.
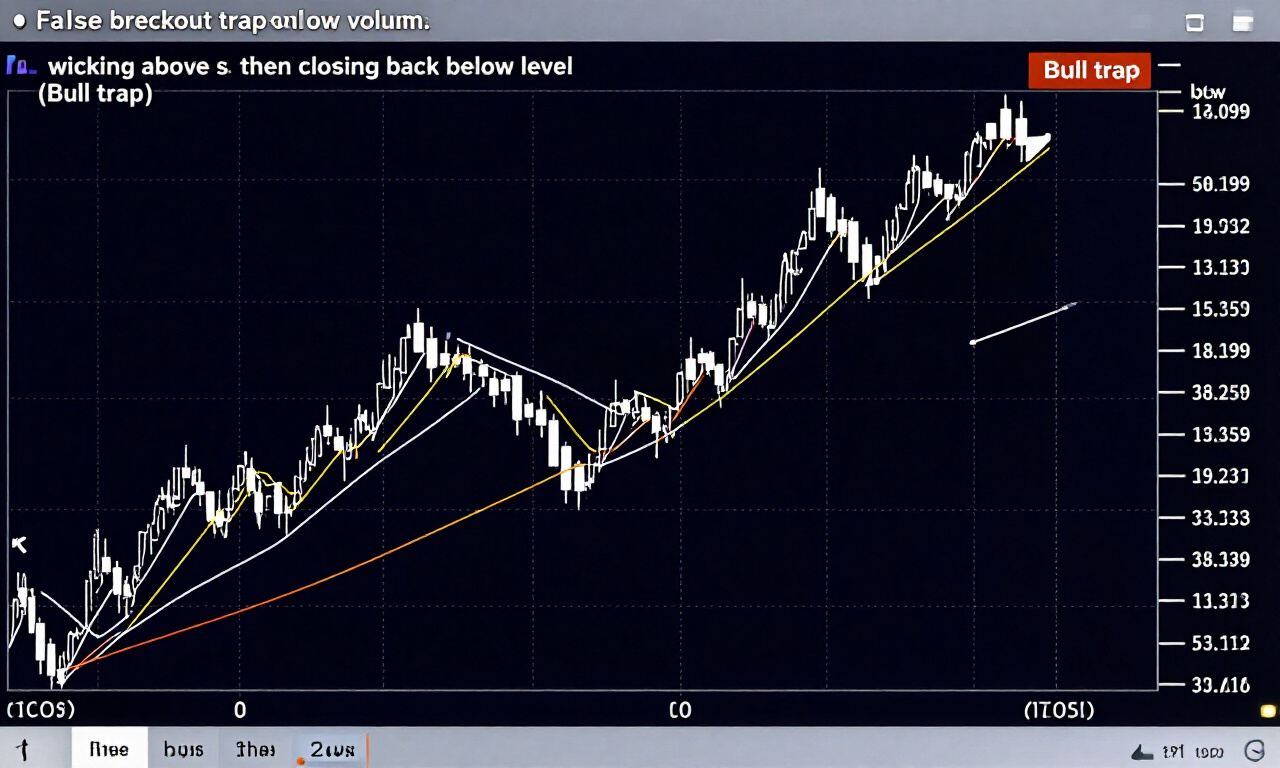
A true break of structure requires a candle close. Wicks that pierce a high but fail to close above it often represent liquidity sweeps or stop-run operations rather than a continuation of the trend. Professionals ignore these “fake-outs” and wait for the body of the candle to confirm that the barrier has been overcome with sufficient volume.
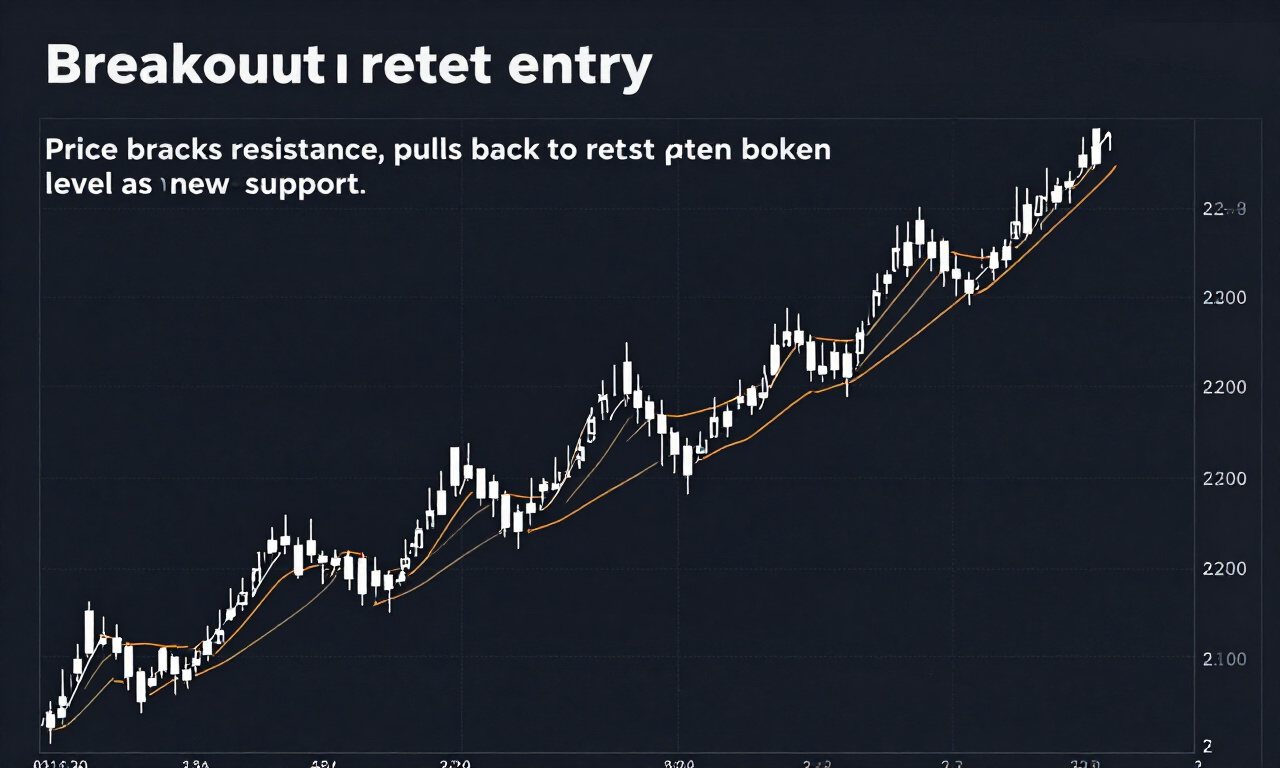
Once a BOS is confirmed, the previous high becomes the new support level. In a strong uptrend, the market often returns to retest this broken resistance, turning it into support. This retest phase provides the highest probability entry for trend-following strategies. Waiting for the retest reduces the distance to your stop-loss and significantly improves the reward-to-risk ratio.
It is essential to distinguish between a break of structure and a change of character. While a BOS signifies that the trend is healthy, a change of character signifies that the trend is ending. Both events are identified through the same observation of higher highs and higher lows, but they carry vastly different implications for current trade management.
Market Reversal Rules and Indicators
Reversals begin with a failure to produce a new structural extreme, followed by a break of the most recent higher low or lower high. This sequence is known as a change of character, acting as the first warning sign that institutional interests have shifted from accumulation to distribution.
Trading reversals is notoriously difficult because a failure to make a new high is not always a reversal; sometimes, it is simply the start of a consolidation range. To filter these false signals, analyze the volume accompanying the break. If the price breaks the last higher low on high volume, the probability of a genuine trend reversal increases exponentially.
Do not rely on RSI or MACD for identifying these structural turns. Oscillators often provide lagging signals that fail to capture the nuance of price pivots. Instead, focus on the interaction between price and historical support or resistance levels. If the price approaches a known resistance and fails to push through it, observe the lower timeframe for a internal structural break.
A professional reversal strategy involves waiting for the “three-touch” rule or a head-and-shoulders pattern combined with the structural break. Once the structure shifts, the previous trend lines become irrelevant. You must immediately begin mapping the new sequence of highs and lows to identify potential targets and defensive stop-loss placements.
Multi-Timeframe Structural Alignment
Successful trading involves aligning the structure of the higher timeframe with the execution logic of the lower timeframe. By observing the daily chart for the macro trend, traders refine their entries by waiting for a structural break on the one-hour or fifteen-minute chart, ensuring maximum precision in entry timing.
If the weekly chart shows a massive uptrend of higher highs and higher lows, looking for short positions on the five-minute chart is statistically inefficient. The higher timeframe always dominates. The goal is to zoom out to identify the macro structural bias and zoom in to find the optimal point of entry that minimizes risk while maximizing exposure to the primary trend.
Many traders become confused when timeframes conflict. If the daily timeframe is bullish but the hourly timeframe is bearish, you are likely in a deep correction. In such cases, avoid trading until the hourly timeframe aligns with the daily or until the price reaches a major daily support zone. Patience is the ultimate technical tool.
Keep a record of how different timeframes interact. When you notice a high on the daily timeframe corresponds with a structural break on the hourly timeframe, you have found a high-confluence zone. These are the moments where institutional capital is most active, providing the best opportunities to enter positions with tight stops and high targets.
Frequently Asked Questions
Understanding market structure is essential for long-term survival in financial markets. These questions address the common technical challenges traders face when identifying trends, structural breaks, and reversal patterns in volatile environments while maintaining a professional standard of risk assessment and objective chart analysis in any market condition.
- What is the most reliable way to confirm a structural break? A structural break is confirmed when a candle body closes clearly beyond a previous pivot point. Avoid relying on wick penetrations, as these are often liquidity hunts designed to stop out retail traders.
- Why is my stop-loss frequently hit during a trend? Stop-losses are often placed too close to structural support or resistance levels. Professionals place stops behind the structural pivot point, ensuring the trade has breathing room to complete its corrective move before continuing the trend.
- How do I handle sideways markets with this strategy? When the market fails to produce higher highs or lower lows, it is in consolidation. During these periods, reduce trading activity or focus on range-bound strategies, buying the support and selling the resistance until a new trend structure emerges.
- Can this strategy be applied to all asset classes? Yes, the concept of higher highs and higher lows is a universal law of price action. It applies equally to forex, equities, commodities, and digital assets because it describes human behavior and liquidity distribution rather than just instrument characteristics.