

The Turtle Trading strategy remains a cornerstone of trend-following methodology, originating from a famous social experiment conducted by Richard Dennis and William Eckhardt in the early 1980s. By teaching novices a rigid set of rules based on breakout identification and volatility-adjusted position sizing, they proved that successful trading relies on strict discipline rather than innate intuition. This system thrives in strong trending markets by capturing the meat of major moves while cutting losses quickly. As a practitioner, you must internalize that the Turtle approach is purely mechanical. It eliminates emotional decision-making, forcing the trader to act only when the market structure confirms a directional bias based on historical price ranges. Understanding these rules is essential for any systematic trader looking to build a robust portfolio in 2026.
Execution of this strategy requires absolute adherence to the mathematical models governing entries, exits, and risk management. This guide breaks down the core mechanics used by the original Turtles to navigate complex financial markets with objective precision.
- Explore comparing systematic trend following with double moving average 9 EMA strategy.
- Explore evaluating Donchian channel breakouts in breakout trading strategy guide.
- Explore tracking position sizing N-units with free Excel trading journal template.
Understanding Turtle Trading Rules and Core Logic
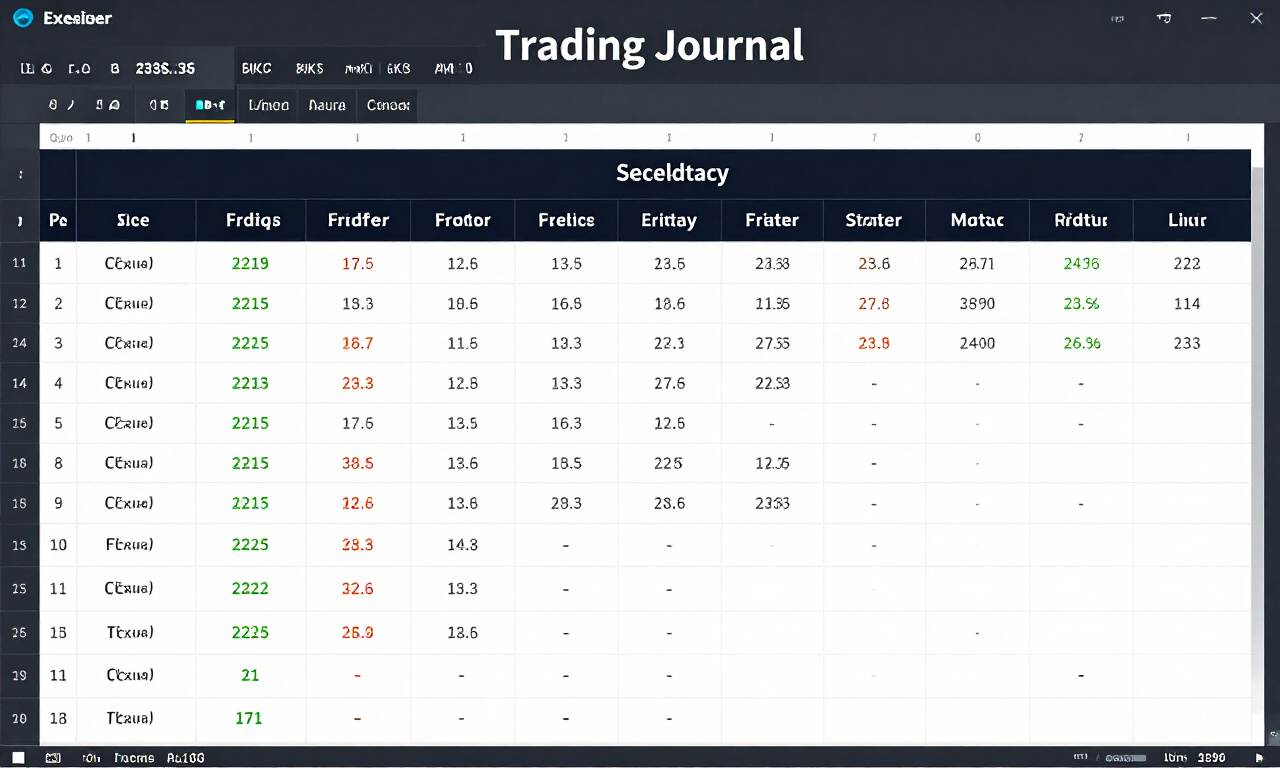
The Turtle Trading strategy functions as a systematic, rules-based framework focused on capturing large market trends through price breakout identification. By utilizing volatility-based position sizing and strict mechanical exits, the method ensures consistent risk management. Traders follow documented signals to enter and exit positions without incorporating subjective market sentiment analysis.
At its heart, the Turtle system operates on the assumption that market trends are predictable and repeatable. The philosophy centers on the idea that if a price makes a new high for a specific period, it demonstrates sufficient momentum to continue moving in that direction. This is a classic trend-following logic.
To implement this successfully, you must ignore the noise of short-term news cycles. The Turtles viewed financial markets as a series of oscillations where the majority of gains come from infrequent, large-scale moves. This approach requires patience, as you will often experience drawdowns while waiting for the right breakout signal to trigger.
Practitioner Pro-Tip: The most common failure point for traders attempting the Turtle method is the urge to adjust stops based on personal fear. You must keep your risk parameters static regardless of individual trade outcomes to maintain the statistical edge.
Donchian Channel Breakout Signals
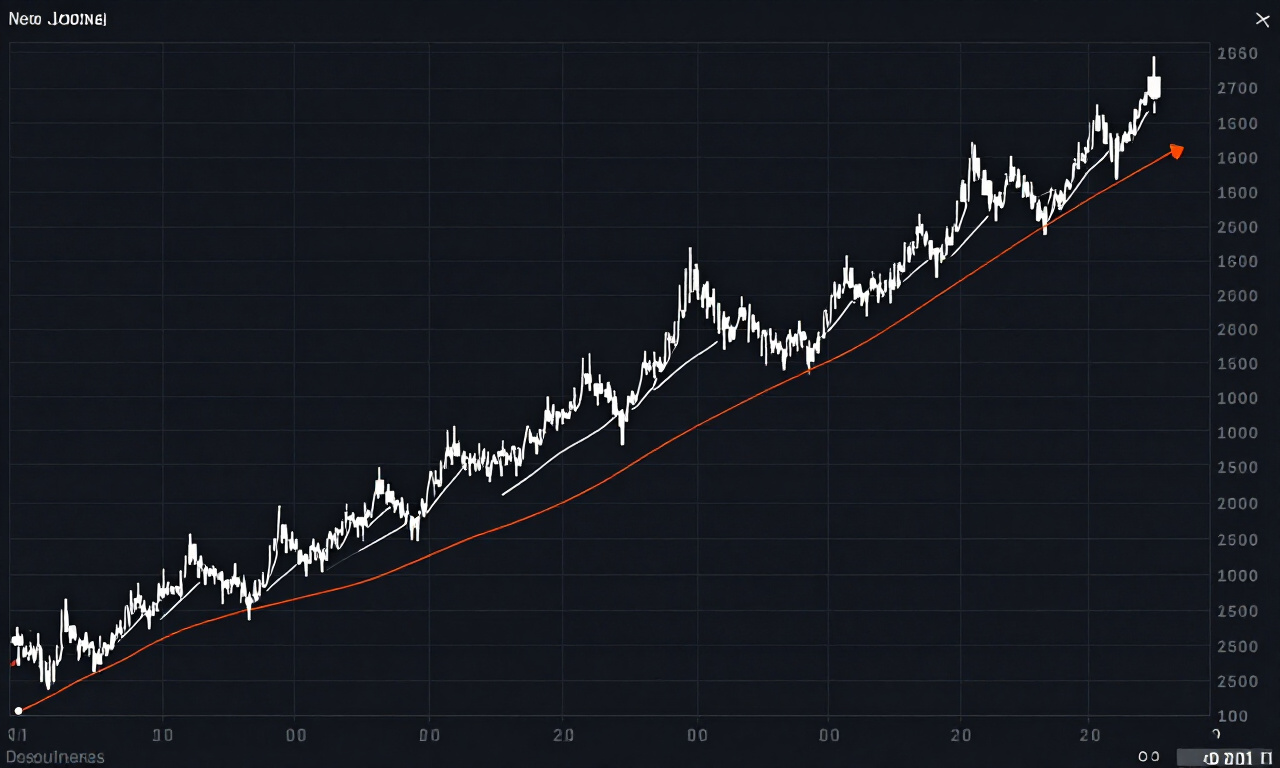
Turtle traders identify entry signals using two distinct Donchian Channel systems designed to capture emerging trends. System 1 uses a 20-day high or low threshold for entry, while System 2 utilizes a more conservative 55-day breakout. These signals serve as the primary catalyst for opening positions in volatile instruments.
System 1 acts as a short-term trend filter. A trade is initiated if the price moves one tick above the high of the previous 20 days. If the trade is profitable, the trader stays in until a 10-day low is hit. This allows for quick capture of short-term price expansions.
System 2 is a long-term trend following component. By waiting for a 55-day breakout, you effectively filter out minor market noise, ensuring you only engage with major structural shifts. This reduces the number of false signals, albeit at the cost of missing the initial part of a move.
System 1 Strategy Dynamics
System 1 is the aggressive edge of the Turtle methodology, relying on a 20-day price channel to determine market entries. When the market exceeds the 20-day high, you open a long position. Conversely, a breach of the 20-day low mandates a short position. This creates a high-frequency opportunity for trend capture.
However, System 1 has a specific nuance regarding losing trades. If the previous breakout resulted in a successful trade, the subsequent breakout signal is typically ignored to prevent over-trading in choppy, range-bound conditions. This rule preserves capital during periods where the market lacks a clear directional bias or sufficient momentum.
Execution requires diligent monitoring of daily candle closes. Since the strategy relies on end-of-day data, it is inherently suited for traders who cannot watch charts every minute. Consistency in tracking the [Donchian channel] levels is the only way to ensure the mathematical validity of your trading plan throughout October and beyond.
System 2 Strategy Dynamics
System 2 provides a more robust, albeit slower, approach by focusing on the 55-day Donchian channel. This is the “big trend” filter. By requiring a longer period of price accumulation before entry, the system confirms that the breakout is backed by substantial institutional flow, rather than a transient liquidity spike.
The primary benefit of System 2 is its resilience in major trending regimes. While System 1 might get stopped out repeatedly during a standard consolidation phase, System 2 remains sidelined, preserving your account equity. Many professional traders combine both systems to balance responsiveness with trend reliability.
When applying this to forex, consider the importance of [liquidity and spreads] as they impact your slippage on breakout orders. Because you are buying into momentum, you must ensure your execution platform can handle market orders at the exact breakout level. Slippage can compound over time, negating your statistical edge.
N-Unit Volatility Sizing
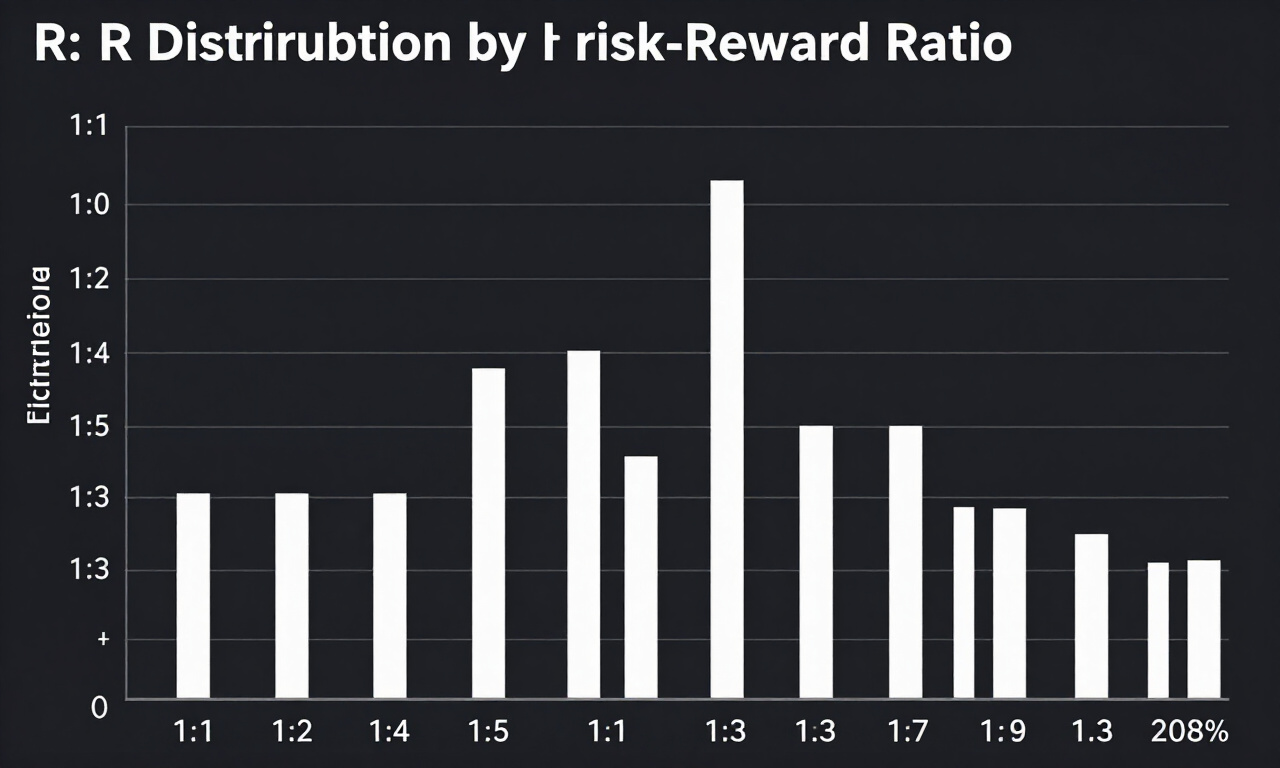
Position sizing in the Turtle system is derived from the Average True Range (ATR), referred to by the Turtles as N. This volatility metric adjusts trade size based on market turbulence, ensuring that each position represents a uniform percentage of account risk, regardless of the instrument’s inherent price volatility.
To calculate N, you first determine the True Range for each day: the maximum of the high minus low, the absolute value of the high minus yesterday’s close, or the absolute value of the low minus yesterday’s close. You then take a 20-day smoothed moving average of these values.
Once you have N, you size your position so that a 1-N move in the price results in a 1% change in your account equity. This is the secret to survival. It prevents a high-volatility instrument from causing catastrophic damage to your portfolio during sudden market dislocations or black swan events.
The calculation is simple: (Account Equity * 0.01) / (N * Dollar Value of 1 Point). By normalizing risk across different asset classes, from commodities to currency pairs, you achieve a balanced portfolio. This is how you manage a diversified [portfolio of financial assets] without over-exposing to any single sector.
Pyramiding and Adding to Winners
Pyramiding is the mechanical process of increasing the size of a winning position as the trend continues in your favor. Turtle traders add 0.5 N-units to their total position for every 0.5 N increment in price move, effectively pressing their advantage while trailing their stop-loss upward to protect gains.
This approach transforms a single winning trade into a significant profit generator. As the price climbs, your total exposure increases, but your average entry price moves higher as well. You stop adding to the position once you hit the maximum allowed number of units per market, usually four.
The beauty of this method is its built-in profit protection. Every time you add a new unit, your stop-loss for the entire trade is moved up. This minimizes the risk of giving back profits on what started as a successful trend. If the market reverses, you are stopped out with a trailing profit.
Practitioner Pro-Tip: Never add to a losing trade. The Turtle rule is to add to winners only. Adding to losers—often called averaging down—is a primary cause of account liquidation. Follow the trend, do not fight it.
Frequently Asked Questions
Turtle trading questions often center on the practical application of breakout systems in modern high-frequency markets. Traders frequently ask about the effectiveness of the N-unit volatility model, how to handle slippage, and the necessity of maintaining diversification across various asset classes to ensure the strategy remains statistically valid.
- Is the Turtle system still effective in 2026? Yes, trend-following remains highly effective. While markets have become faster, the psychological drivers of price exhaustion and momentum breakout remain constant, ensuring that the core logic of the Turtle system continues to generate positive expectancy.
- How do I handle drawdowns? Drawdowns are a feature of the Turtle system. Because you only win on big trends, you must accept periods of small, frequent losses. Maintaining the exact risk-per-trade percentage is the only way to ensure you survive long enough to catch the next major market move.
- Can I use this for day trading? The Turtle system was designed for daily charts. While it can be adapted for lower timeframes, the signals become significantly noisier. Successful practitioners typically focus on daily or weekly charts to maximize the signal-to-noise ratio and reduce transaction costs.
- What is the maximum risk per trade? The standard Turtle rule is to never risk more than 1% of total account equity on a single trade. By calculating position size based on the N-value, you keep your risk constant regardless of how many units you accumulate as the trend evolves.