
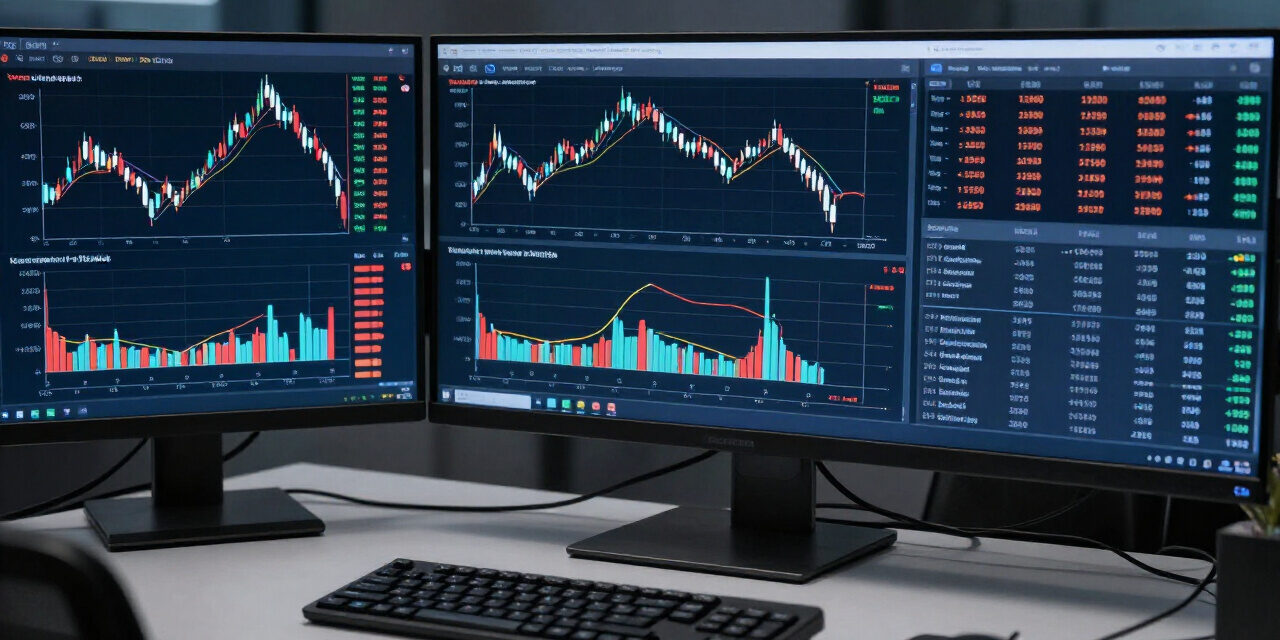
What Are Stock Derivatives? Complete Guide (2026)
Have you ever watched your favorite stock plummet 10% in a single day, wishing you had a way to protect your hard-earned wealth? Or perhaps you wanted to trade a large stock position without locking up your entire trading capital? In modern financial markets, traditional stock buying is only half the picture. Professional traders and institutions manage risk and generate alpha using options futures contracts. If you want to build steady market confidence, learning what is derivatives in stock market trading is no longer optional. It is an essential skill. In this complete 2026 guide, we will unpack how financial derivatives work, explore the mechanics of options and futures, walk through real-world case studies, and give you the tools to trade smartly across Indian and global exchanges.
Table of Contents
- What Are Stock Market Derivatives? Core Concepts and Meaning
- The Two Giants: Understanding Options Futures in Modern Markets
- Key Differences: Options and Futures Compared
- Real-World Hedging Case Studies: Managing Risk in Volatile Markets
- Mechanics of Derivatives in Share Market: Margins, Greeks, and Settlement
- Global vs Indian Derivatives Markets: NSE, BSE, CME, and Beyond
- Step-by-Step Practical Calculations and Interactive Payoff Guide
- Risk Management, SEBI Regulations, and Common Trader Pitfalls
- Conclusion and Key Takeaways
What Are Stock Market Derivatives? Core Concepts and Meaning
The Fundamental Definition: Derivative Meaning in Stock Market
To grasp the derivative meaning in stock market terms, think of milk and cheese. Cheese has no independent value; its price, supply, and existence depend entirely on milk. If milk prices rise, cheese prices usually climb as well. In the same way, a financial derivative is a contract between two or more parties whose value is derived directly from the price of an underlying asset.
When investors ask, what are derivatives in stock market accounts, they are referring to financial instruments whose performance tracks assets like individual stocks, market indices, commodities, currencies, or interest rates. Instead of buying actual shares of a company, you trade contracts that mirror or amplify the price movements of those shares. You can learn more about specific equity instruments in our [LINK: /stock-derivatives-guide/].
How Underlying Assets Derive Value
A derivative contract cannot exist in a vacuum. The underlying asset dictates the cash flows, settlement obligations, and pricing models of the derivative. In equity markets, the most common underlying assets include:
- Individual Equities: Single stocks like Reliance Industries, Tata Motors, Apple, or Microsoft.
- Market Indices: Broad baskets of stocks like the Nifty 50, Bank Nifty, S&P 500, or Nasdaq 100. For an in-depth breakdown of index trading, read our [LINK: /index-derivatives/].
- Commodities: Gold, crude oil, silver, and agricultural products.
- Currencies: Currency pairs like USD/INR, EUR/USD, or GBP/INR.
When the spot price (the cash market price) of the underlying asset shifts, the price of the derivative changes in response based on mathematical formulas that account for time, volatility, and interest rates.
Derivatives Taxonomy Decision Tree: Choosing the Right Instrument
Traders often struggle to decide which instrument suits their goals. The decision tree below simplifies the classification of derivatives based on trading venues, obligations, and strategies:
Derivatives Taxonomy Decision Tree
1. Do you need a standardized, liquid contract traded on a public exchange?
└─ YES: Exchange-Traded Derivatives (ETDs)
├─ Want an obligation to buy/sell at a set price? → Futures Contracts
└─ Want the right (not obligation) to buy/sell? → Options Contracts (Calls / Puts)
└─ NO: Over-The-Counter (OTC) Derivatives (Customized between private parties)
├─ Custom forward delivery agreement? → Forwards
└─ Exchange of future cash flows? → Swaps (Interest rate swaps, currency swaps)
For retail traders, Exchange-Traded Derivatives are the gold standard because clearinghouses guarantee every trade, virtually eliminating counterparty default risk.
The Two Giants: Understanding Options Futures in Modern Markets
What Are Futures Contracts? (Mechanics, Margins, Mark-to-Market)
A futures contract is a legally binding agreement between a buyer and a seller to trade an underlying asset at a predetermined price on a specified future date. Both parties are locked in. The buyer must buy, and the seller must deliver or cash-settle.
To trade futures, you do not pay the full asset value upfront. Instead, you deposit an initial margin (often 15% to 25% of total contract value). Every trading day, the exchange runs a Mark-to-Market (MTM) process. If your position gains value, cash is credited to your margin account. If it loses value, funds are debited. If your margin falls below the maintenance threshold, your broker will issue a margin call requiring immediate deposits.
What Are Derivative Options? (Calls, Puts, Strike Prices, Premiums)
When exploring derivative options, the fundamental rule changes from obligation to choice. An option gives the buyer the right, but not the obligation, to buy or sell an underlying asset at an agreed price (the strike price) within a defined period.
- Call Option (CE): Gives the buyer the right to buy the asset. You purchase a Call when you expect prices to climb.
- Put Option (PE): Gives the buyer the right to sell the asset. You purchase a Put when you expect prices to drop.
- Option Premium: The non-refundable cash price paid by the option buyer to the option seller (writer) upfront for this right.
Unlike futures buyers, who face linear risk, option buyers cap their maximum potential loss strictly at the premium paid upfront. Check out our foundational guide on [LINK: /futures-trading-basics/] to see how options contrast with basic linear contracts.
Visual Payoff Guide: Futures vs Options Payoff Profiles
Understanding profit and loss (P&L) trajectories is critical for active market participants. Here is a clear visual representation of how both contract families behave at expiry:
FUTURES PAYOFF PROFILE (Linear P&L)
Profit ^               / (Long Future: Unlimited Gain)
       |              /
       |             /
 Price |------------/------------> Stock Price
       |           /
       |          /
  Loss v         / (Long Future: Unlimited Loss)

-----------------------------------------------------------

CALL OPTION PAYOFF PROFILE (Asymmetric P&L)
Profit ^                   / (Long Call: Unlimited Upside)
       |                  /
       |                 /
  Zero |________________/________> Stock Price
-Prem. |_______________/ (Strike Price)
  Loss v (Max Loss Capped at Premium Paid)
As the diagrams demonstrate, futures provide symmetric risk: your gains and losses rise and fall dollar-for-dollar with the market. Options offer asymmetric risk: option buyers enjoy uncapped or significant upside while defining their dollar risk down to the exact penny paid for the premium.
Key Differences: Options and Futures Compared
Obligations vs Rights: Structural Differences
The primary distinction in options futures trading lies in contractual commitment. A futures contract is an active obligation for both the long (buyer) and short (seller). If you hold a long Nifty futures contract into expiry, you must settle the exact difference between your entry price and the final settlement price, regardless of how far the index drops.
In an option contract, the power dynamic is one-sided. The buyer pays a premium to obtain total freedom of execution. If the market moves unfavorably, the buyer simply lets the contract expire worthless. The option seller, however, collects that premium and takes on the mandatory obligation to perform if the buyer decides to exercise.
Capital Requirements: Margins vs Premiums
Capital utilization creates another stark divide between these two instruments:
- Futures Trading: Both buyers and sellers must maintain substantial margin collateral throughout the life of the trade. If volatility spikes, exchanges increase margin requirements overnight.
- Option Buying: Requires only the upfront premium amount. There are no ongoing margin calls or additional capital requirements.
- Option Selling (Writing): Requires substantial margin capital comparable to futures, because the seller’s potential risk profile is theoretically unlimited if the trade moves against them.
Comparison Table: Options Futures at a Glance
The table below summarizes the core differences between these two foundational stock market derivatives:
| Feature | Futures Contract | Options Contract (Buyer) | Options Contract (Seller) |
|---|---|---|---|
| Obligation | Mandatory for both parties | Right, but no obligation | Mandatory if exercised |
| Initial Outlay | Margin (15% – 25% typical) | Premium paid upfront | Full margin required |
| Profit Potential | Unlimited | Unlimited (Call) / Substantial (Put) | Capped at premium received |
| Downside Risk | Unlimited / Substantial | Limited strictly to premium paid | Unlimited (Call) / Substantial (Put) |
| Time Decay Impact | Neutral (Priced by cost-of-carry) | Negative (Theta hurts buyer) | Positive (Theta benefits seller) |
| Payoff Structure | Linear | Non-linear (Asymmetric) | Non-linear (Asymmetric) |
Real-World Hedging Case Studies: Managing Risk in Volatile Markets
Case Study 1: The Commodity Hedger (Farmer / Agricultural Producer)
Consider a large soybean farmer in Madhya Pradesh, India. In June, the farmer plants a crop that will be harvested and ready for market in October. The farmer calculates that production costs equal 4,200 INR per quintal. If market prices collapse to 3,800 INR by harvest, the farm will face deep losses.
To eliminate this threat, the farmer sells October Soybean Futures on the National Commodity and Derivatives Exchange (NCDEX) at 4,800 INR per quintal. By selling futures, the farmer locks in a fixed sale price. When October arrives, if the spot price falls to 3,900 INR:
- Physical Market Loss: Sells harvest locally at 3,900 INR (a 300 INR loss relative to production cost).
- Futures Gain: Buys back the futures contract at 3,900 INR, realizing a 900 INR profit per quintal.
- Net Realized Sale Price: 3,900 + 900 = 4,800 INR per quintal. The farm’s operating profit is saved.
Case Study 2: The Currency Hedger (IT Exporter Managing USD/INR)
An Indian software services company signs a deal expecting an incoming payment of 1,000,000 USD from an American client in three months. The spot exchange rate today is 83.50 INR per USD. If the Indian Rupee appreciates against the dollar to 81.00 INR, the company’s revenue falls from 83,500,000 INR to 81,000,000 INR, erasing 2,500,000 INR in operating margin.
To hedge this currency exposure, the company sells USD/INR Currency Futures on the NSE at 83.70 INR. If the dollar depreciates to 81.50 INR by settlement date, the firm absorbs lower cash receipts on its invoice conversion but offsets that loss rupee-for-rupee with profits generated from its short currency futures position.
Case Study 3: The Equity Portfolio Manager (Hedging via Nifty 50 Put Options)
Imagine a mutual fund manager overseeing an Indian blue-chip stock portfolio valued at 10 Crore INR. General elections are approaching, and the manager fears short-term political volatility could trigger a 10% market crash. However, selling the actual stocks would trigger steep capital gains taxes and costly transaction fees.
Instead, the manager buys out-of-the-money (OTM) Nifty 50 Put Options expiring right after the election. If the stock market dives 8%, the underlying portfolio loses approximately 80 Lakhs INR in value. However, the Put options surge in value, generating roughly 75 Lakhs to 80 Lakhs INR in derivatives profit. The manager insulates the portfolio against the selloff without liquidating a single share.
Margins and Leverage: SPAN, Exposure, and Peak Margin Rules
When trading a derivative in share market environments like the National Stock Exchange of India (NSE) or Bombay Stock Exchange (BSE), margin calculation follows strict regulatory systems mandated by the Securities and Exchange Board of India (SEBI). The system comprises two main parts:
- SPAN Margin (Standard Portfolio Analysis of Risk): Calculates the maximum possible portfolio loss over a one-day horizon based on statistical simulations of price and volatility shifts.
- Exposure Margin: An extra buffer levied by exchanges to protect against extreme intraday tail risks beyond normal SPAN estimates.
Under SEBI peak margin rules, brokers must collect 100% of the total margin requirement upfront before trade execution. Intraday margin relief or excessive leverage from broker loans is prohibited, shielding the broader market from clearing defaults.
The Option Greeks Explained: Delta, Gamma, Theta, Vega
To trade derivative options with consistency, you must understand the mathematical factors that govern pricing, known as the Option Greeks:
- Delta: Measures how much an option’s premium changes for every 1-point move in the underlying asset. A Call with a 0.50 Delta will rise by 0.50 INR if the underlying stock rises by 1.00 INR.
- Gamma: Measures the rate of change in Delta for each point move in the underlying asset. High Gamma makes an option’s Delta accelerate rapidly.
- Theta: Represents time decay. Options lose value every day as expiry approaches. Theta measures the daily rate of decay, working against option buyers and in favor of option sellers.
- Vega: Measures an option’s sensitivity to shifts in Implied Volatility (IV). When uncertainty rises, options prices jump across the board due to higher Vega demand.
To discover how advanced market participants package these Greeks into structured trades, read our guide on [LINK: /options-strategies/].
Settlement Mechanisms: Cash Settlement vs Physical Delivery
Derivatives wrap up on their expiration date through one of two mechanisms:
- Cash Settlement: No physical goods change hands. The difference between the entry price and the closing settlement price is exchanged in cash. Index futures and options (like Nifty 50 and S&P 500) are almost universally cash-settled.
- Physical Delivery: The buyer takes legal receipt of actual shares, and the seller delivers them. Under SEBI regulations, all in-the-money (ITM) single-stock futures and stock options contracts on the NSE must be physically delivered. If you hold an ITM stock derivative into expiry, you must possess enough cash or actual shares in your demat account to settle the contract in full.
Global vs Indian Derivatives Markets: NSE, BSE, CME, and Beyond
The Indian Landscape: NSE Dominance, SEBI Regulations, and Recent Frameworks
India is a global powerhouse in derivative trading volume. According to the Futures Industry Association (FIA), the NSE regularly ranks as the world’s largest derivatives exchange by total contract volume, driven by liquid index options like Nifty 50 and Bank Nifty.
SEBI actively monitors trading activities to safeguard retail capital. In 2026, SEBI and the NSE have enhanced trading guidelines by standardizing lot sizes, tightening index derivative expiries to limit speculative intraday churn, and hiking minimum contract values to ensure retail participants trade within their risk limits.
Global Giants: CME Group, Eurex, and SGX
Outside of India, international institutional trading centers on major global clearinghouses:
- CME Group (Chicago Mercantile Exchange): The benchmark marketplace for commodities, agricultural futures, Treasury interest rate products, and major stock index futures like the E-mini S&P 500.
- Eurex: Europe’s premier derivatives exchange, anchoring benchmark liquidity in European bonds (Euro-Bund) and equities (Euro STOXX 50).
- SGX (Singapore Exchange): A vital offshore financial hub where global funds hedge Asian exposures, historically home to the SGX Nifty (now trading as GIFT Nifty in India’s GIFT City).
Comparison Table: Indian Derivatives vs Global Derivatives Markets
| Parameter | Indian Markets (NSE / BSE) | US Markets (CME / CBOE) | European Markets (Eurex) |
|---|---|---|---|
| Primary Volume Driver | Index Options (Weekly / Monthly) | Index Futures, Single-Stock Options | Interest Rate & Index Futures |
| Contract Style | European Style for Index & Stock Options | American Style for Equity Options | European & American Options |
| Regulatory Oversight | SEBI | CFTC and SEC | ESMA / BaFin |
| Stock Derivative Settlement | Mandatory Physical Delivery | Physical Delivery (Shares) | Physical Delivery or Cash |
| Taxation Profile | STT, GST, Stamp Duty, Business Income (F&O) | Section 1256 (60/40 rule on futures) | Capital Gains Tax by Jurisdiction |
Step-by-Step Practical Calculations and Interactive Payoff Guide
Futures P&L and Margin Calculation Example
Let us look at a practical trade on a single-stock futures contract on the NSE:
- Stock: XYZ Limited Futures
- Lot Size: 250 shares
- Entry Price: 2,000 INR
- Contract Value: 2,000 INR × 250 = 500,000 INR
- Required Margin (SPAN + Exposure @ 20%): 100,000 INR
If XYZ Limited climbs to 2,080 INR by the time you close the trade:
- Points Gained: 2,080 – 2,000 = 80 points
- Total Gross Profit: 80 × 250 = 20,000 INR
- Return on Capital Invested (ROIC): 20,000 / 100,000 = 20%
Notice the power of leverage: the stock moved only 4% (from 2,000 to 2,080 INR), but your trading margin produced a 20% return. However, if the stock had fallen 4% to 1,920 INR, you would have suffered an identical 20,000 INR loss (20% of your capital).
Options Trade P&L Calculation (Call and Put Scenarios)
Now consider buying a Call option on the Nifty 50 index:
- Current Index Value: 22,000
- Strike Price: 22,100 Call (CE)
- Lot Size: 25 units
- Premium Paid: 120 INR per unit
- Total Capital Required: 120 INR × 25 = 3,000 INR
- Breakeven Level at Expiry: Strike Price + Premium = 22,100 + 120 = 22,220
Scenario A: Big Rally at Expiry (Index closes at 22,400)
Intrinsic Value = 22,400 – 22,100 = 300 INR.
Net Gain per unit = 300 – 120 (premium paid) = 180 INR.
Total Profit = 180 × 25 = 4,500 INR (a 150% return on invested capital).
Scenario B: Market Consolidates or Drops (Index closes at 22,050)
The 22,100 Call finishes out-of-the-money. Its intrinsic value is 0.
Total Loss = 3,000 INR (100% of the premium paid). You cannot lose more than the 3,000 INR initially deposited, no matter how low the index crashes.
How an Interactive Derivatives Payoff Calculator Works
Modern algorithmic platforms use interactive payoff calculators to help traders model risk before clicking buy. An interactive payoff calculator runs on three inputs:
- Position Parameters: Entry price, strike price, contract expiry, lot size, and long/short direction.
- Market Volatility: Current Implied Volatility (IV) input via the Black-Scholes pricing model.
- Time Slider (Days to Expiration – DTE): Visualizes how Theta eats away option value day-by-day.
By adjusting these inputs on a live chart, you can visualize your maximum risk, your breakeven thresholds, and the exact probability of profit (POP) before committing your capital to the market.
Risk Management, SEBI Compliance, and Common Trader Pitfalls
Leverage: The Double-Edged Sword (The SEBI Study)
A landmark research study published by SEBI revealed that 9 out of 10 individual retail traders in India lost money trading futures and options (F&O), with average net losses running into tens of thousands of rupees per trader. The reason for these losses is rarely a lack of market information. Instead, it is the misuse of financial leverage.
Because derivatives allow you to control large contract values with small upfront margins, traders often over-leverage their accounts. When a trade goes against an over-leveraged account, standard market fluctuations can trigger catastrophic capital wipeouts within minutes.
Essential Risk Mitigation Rules
To survive and thrive in derivatives in stock market trading, implement these mandatory ground rules:
- Enforce Hard Stop Losses: Never hold an open position without an automated stop-loss order placed directly with the exchange clearinghouse.
- Limit Risk Per Trade: Never risk more than 1% to 2% of your total trading capital on any single trade setup.
- Avoid Holding ITM Stock Options into Expiry: Unless you are fully funded to accept physical delivery of thousands of shares, square off in-the-money single-stock options before final settlement to prevent physical delivery liquidity crunches.
- Respect Volatility: Avoid buying expensive, high-IV options right before earnings reports or election announcements, as post-event volatility collapse (IV crush) can destroy premiums even if the stock moves in your predicted direction.
Regulatory Disclaimers and Warnings
???? Parent Guide: Core Concepts – Complete Guide
???? Related: How Derivatives Work →
???? Parent Guide: Core Concepts – Complete Guide
???? Related: How Derivatives Work →


Trackbacks/Pingbacks