
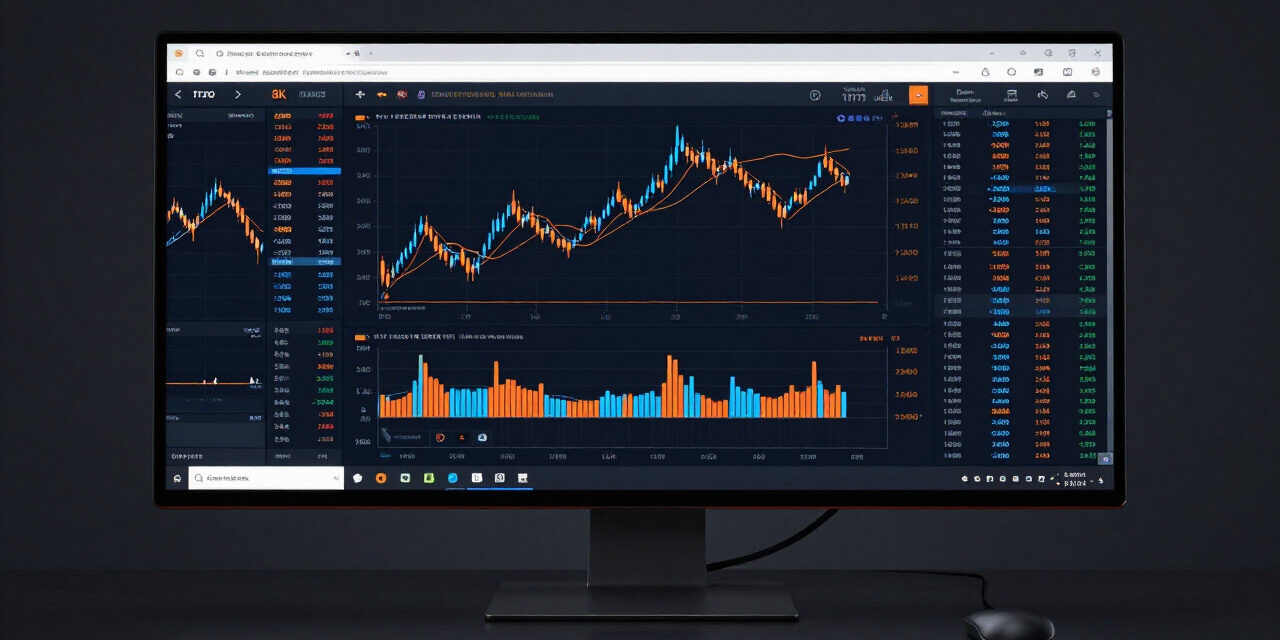
Modern market structure analysis requires a transition from lagging indicators to real-time execution telemetry. An professional order flow trader shifts their focus from static candlestick patterns to the underlying liquidity mechanics fueling price movement. By integrating Cumulative Volume Delta, Market Profile distributions, and Depth of Market (DOM) visualization, market participants gain granular visibility into the hidden battles between aggressive market orders and passive limit orders. This guide dissects the tactical implementation of these high-frequency tools, providing the framework for institutional-grade decision making in [currentmonth] [currentyear]. Success in current volatility regimes depends on identifying where large capital is absorbing supply or exhausting demand, rather than merely observing price levels in a vacuum. Traders who master these metrics stop guessing price direction and start analyzing the mechanics of trade execution across fragmented liquidity pools.
Execution precision relies on understanding how [order flow] manifests within the [footprint chart]. This involves moving beyond standard time-based charts toward volume-weighted analysis. In this guide, we examine the quantitative variables that dictate order flow success, ensuring you possess the technical depth to interpret market auction dynamics effectively.
- Explore monitoring cumulative volume delta during liquidity sweep trading setups.
- Explore analyzing footprint charts in complete ICT trading strategy guide.
- Explore executing DOM order book scalps in tick scalping and naked FX guide.
Footprint Chart Mechanics for Order Flow Traders
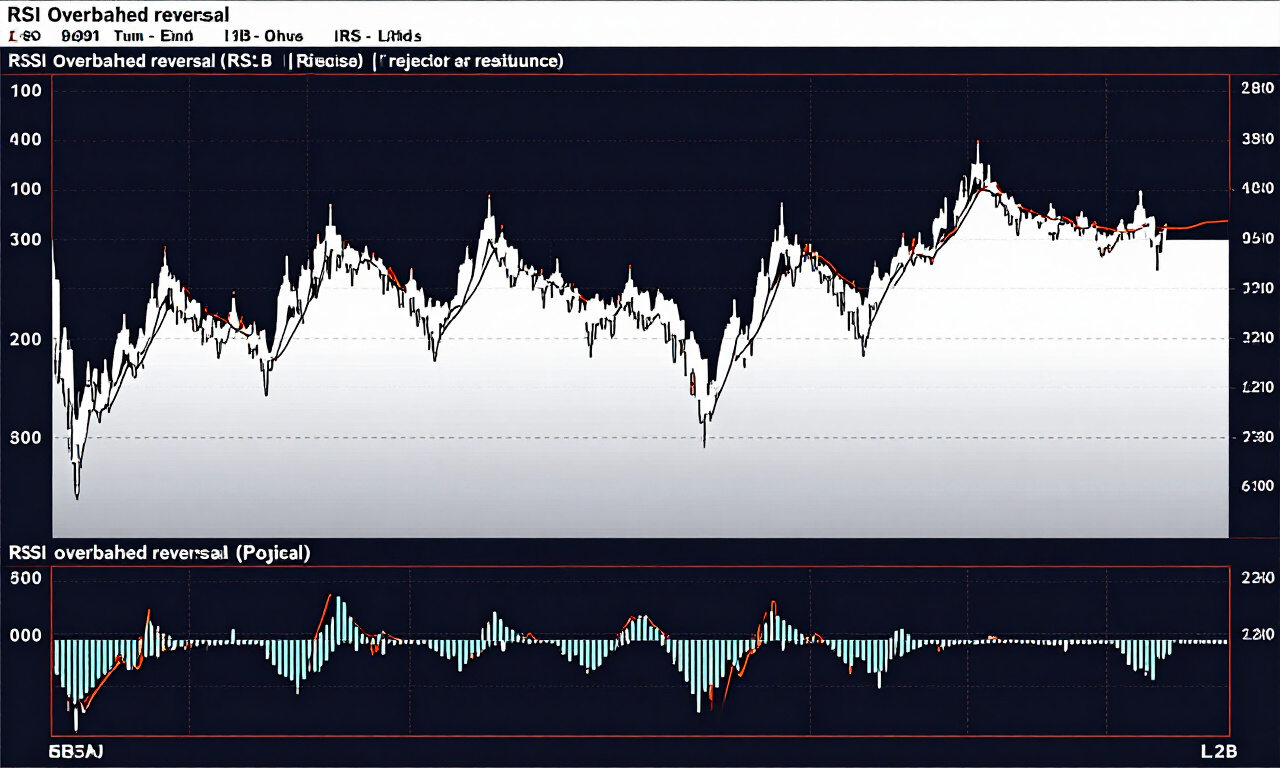
Footprint charts display the volume traded at each specific price level within a single candle, effectively breaking down the bid and ask activity. By visualizing the imbalance between aggressive buyers and aggressive sellers, traders can identify structural trap zones where liquidity providers are being overwhelmed or finding support.
The footprint chart is the most direct representation of real-time market auction theory. Unlike a standard candle which only shows open, high, low, and close, the footprint reveals the intensity of transactions at the tick level. A professional [order flow trader] looks for “delta imbalances” within these candles, which occur when aggressive buying or selling significantly outweighs the opposing side at a specific price point.
When you observe a footprint, your primary task is to identify “unfilled” volume or “low volume nodes” that act as structural magnets. If you notice a high concentration of volume at a specific price followed by a rapid rejection, it indicates that institutional market participants have absorbed the incoming orders to flip the directional bias.
Practitioner Pro-Tip: Always scan for “stacked imbalances” where three or more consecutive price levels show aggressive net volume in one direction. This typically signals a strong intent to move price, often serving as a catalyst for a breakout or a trend continuation setup.
Cumulative Volume Delta (CVD) Analysis
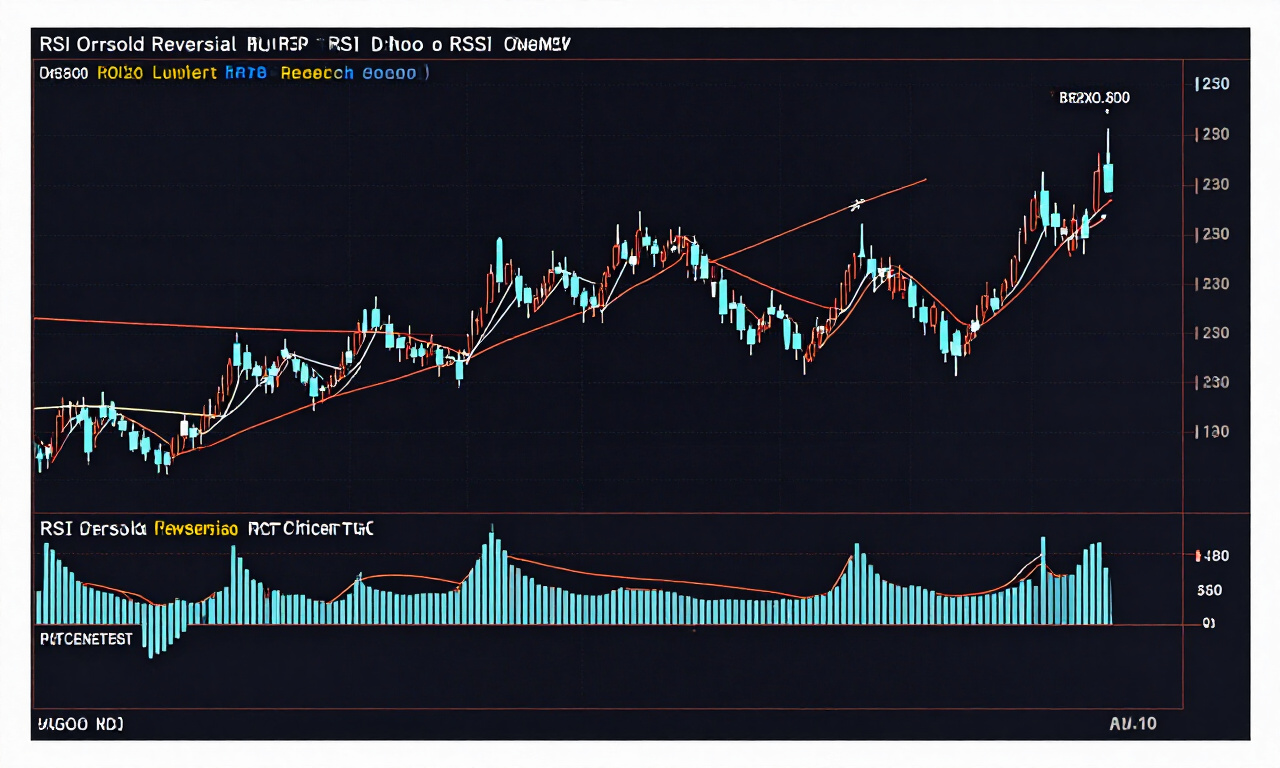
Cumulative Volume Delta tracks the running net difference between aggressive buy orders and aggressive sell orders over a specific timeframe. By measuring the divergence between price action and delta flow, traders identify exhaustion points or hidden accumulation patterns that are invisible to participants using standard momentum oscillators or moving averages.
The core strength of Cumulative Volume Delta (CVD) lies in detecting divergences. If the price reaches a new high while the CVD fails to make a corresponding peak, you have identified a classic “Delta Divergence.” This indicates that while price is moving up, the aggressive buying force is diminishing, often warning of a potential trend reversal or a liquidity grab at higher levels.
Traders should correlate CVD movements with session-based volume profiles. During [currentyear], market participants often see “delta traps” where institutional desks initiate large positions that cause delta to spike, yet price remains trapped in a range. This is often the precursor to a volatility expansion. Tracking the [market data] through CVD helps strip away the noise of retail-driven fluctuations.
- Bullish Divergence: Price makes a lower low while CVD makes a higher low, suggesting selling exhaustion.
- Bearish Divergence: Price makes a higher high while CVD makes a lower high, suggesting institutional distribution.
- CVD Correlation: Strong trends exhibit expanding delta consistent with price direction.
Market Profile and Value Area Dynamics
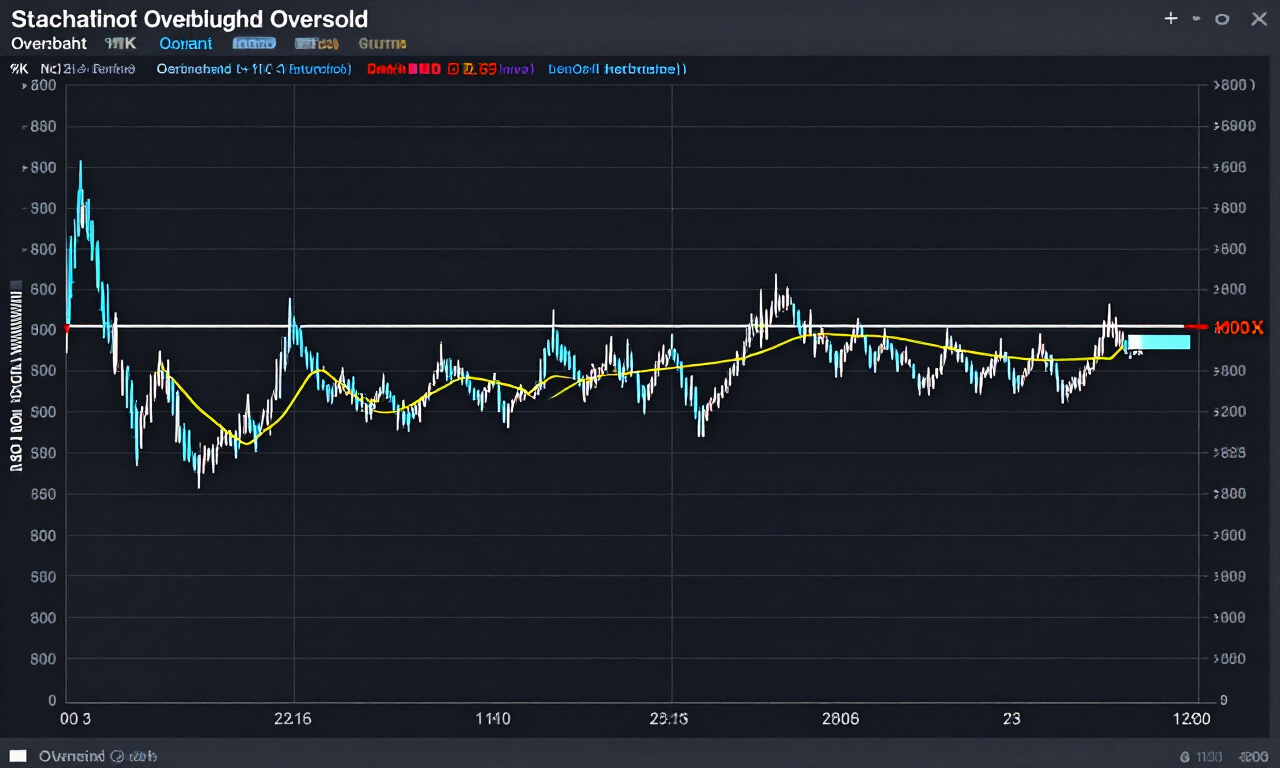
Market Profile organizes price data into a bell curve distribution to identify the Value Area, where 70 percent of all transactions occur during a session. This statistical framework allows traders to define zones of fair value, helping them distinguish between rotational market phases and impulsive, trending price movements.
A sophisticated [order flow trader] uses the [Value Area] to determine whether the market is in a breakout phase or a mean-reversion phase. When price breaks out of the Value Area High (VAH) or Value Area Low (VAL), the market is effectively attempting to find a new discovery phase. If the price returns into the Value Area quickly, it constitutes a “failure,” indicating that the market still perceives the previous range as fair value.
The Point of Control (POC) represents the single price level with the highest traded volume. In institutional environments, the POC acts as a structural anchor. If the market is trading below the POC, the bias is bearish. If trading above, the bias is bullish. Understanding the relationship between current price and the POC is essential for scaling positions effectively during high-volatility events in [currentmonth].
Integrating Depth of Market (DOM) and Ladder Trading
The Depth of Market, or DOM, provides a real-time visualization of the passive limit order book, showing the pending buy and sell orders at various price levels. By monitoring the speed at which orders are added or pulled from the ladder, traders infer the intent of liquidity providers and institutional market makers.
DOM trading is the final stage of order flow analysis. While footprint charts and CVD show what has already happened, the ladder shows what is waiting to happen. A key signal is “spoofing” or “layering,” where large buy or sell walls appear suddenly on the DOM. Most professional traders avoid placing trades based solely on these walls because they are often cancelled once price approaches them.
Instead, look for “price absorption.” If the market hits a bid wall and the wall does not shrink despite heavy selling, it means a large participant is absorbing that supply. This is a high-probability entry point. Watching the tape for this specific interaction separates the professional order flow trader from those reacting blindly to candle closes. You must maintain focus on the “speed of tape” to gauge the conviction behind the order flow.
Advanced Order Flow Filtering Techniques
Advanced filtering involves isolating institutional block trades from retail activity by setting volume thresholds on footprint data. By ignoring small trades that constitute noise, traders focus their attention solely on high-impact transactions that alter the market equilibrium and set the structural direction for the upcoming trading session.
Filtering requires a disciplined approach to [data management]. Many platforms allow you to highlight or sound-alert when a trade size exceeds a specific contract limit. This acts as a beacon for institutional activity. If you are trading, for example, the E-mini S&P 500, you might filter for blocks of 50 or more contracts to identify where the professional money is positioning.
Combining these filters with delta analysis produces a high-edge methodology. When a significant block trade occurs at the same time as a spike in Cumulative Volume Delta, the resulting price movement is far more likely to be sustained. This creates a logical trade entry that relies on mechanical evidence rather than lagging indicators or emotional bias. Always remember that volume is the primary data source; everything else is secondary.
Practitioner Pro-Tip: Do not over-filter. If you set your thresholds too high, you might miss the subtle accumulation phase that occurs before a major move. Keep a balanced view where you see both the large block trades and the general flow of market participants.
Frequently Asked Questions
Order flow trading represents the most transparent way to analyze markets by focusing on actual volume transactions. By understanding the interaction between passive liquidity on the DOM and aggressive market orders, you gain a distinct advantage over retail participants relying on delayed technical signals like moving averages or RSI indicators.
- What is the main difference between order flow and technical analysis? Technical analysis uses historical price data to predict future moves. Order flow analysis uses real-time transaction data to observe current market behavior, liquidity levels, and institutional intent, providing a more immediate and mechanical view of supply and demand imbalances.
- How do I start learning footprint charts effectively? Begin by analyzing high-volume areas in historical data. Look for imbalances where one side aggressively overwhelmed the other. Use a simulator to practice identifying these zones in real-time, focusing specifically on how price reacts when it returns to those historical imbalance zones.
- Is Cumulative Volume Delta reliable in low-volume markets? CVD is less reliable in low-volume conditions because the sample size is insufficient to represent true institutional activity. Always prioritize order flow tools during the London and New York session overlaps, where liquidity and volume provide the most accurate representation of market sentiment.
- What is the role of the Value Area in order flow? The Value Area acts as a distribution map. It identifies the “fair price” zone. Trading setups generally involve either mean reversion back to the POC or breakout plays when price successfully auctions away from the Value Area limits with confirmed volume support.