
Modern retail trading has shifted significantly toward institutional-centric methodologies. ICT trading, or Inner Circle Trader concepts, represents a framework built on the premise that markets are manipulated by liquidity providers. By identifying specific footprints of large-scale capital, traders transition from reactive price action analysis to proactive predictive modeling based on market efficiency algorithms and institutional imbalances. This guide serves as a technical blueprint for the [currentmonth] [currentyear] market environment, focusing on the mechanical application of price delivery models rather than subjective indicators.
The core objective is to align retail positions with the displacement of institutional order flow. Whether operating on higher timeframes for swing positions or granular intraday sessions, the synergy between liquidity sweeps and fair value gaps forms the backbone of consistent market participation. Success requires a transition away from traditional technical analysis toward a deep understanding of how order blocks and market structure shifts drive price across major currency pairs and indices.
- Explore trading failed order blocks using breaker block trading setups.
- Explore analyzing daily Open-High-Low-Close cycles in Power of 3 (PO3) ICT strategy.
- Explore identifying institutional stop-hunts via liquidity sweep trading.
Understanding ICT Market Structure and Shift in Market Structure
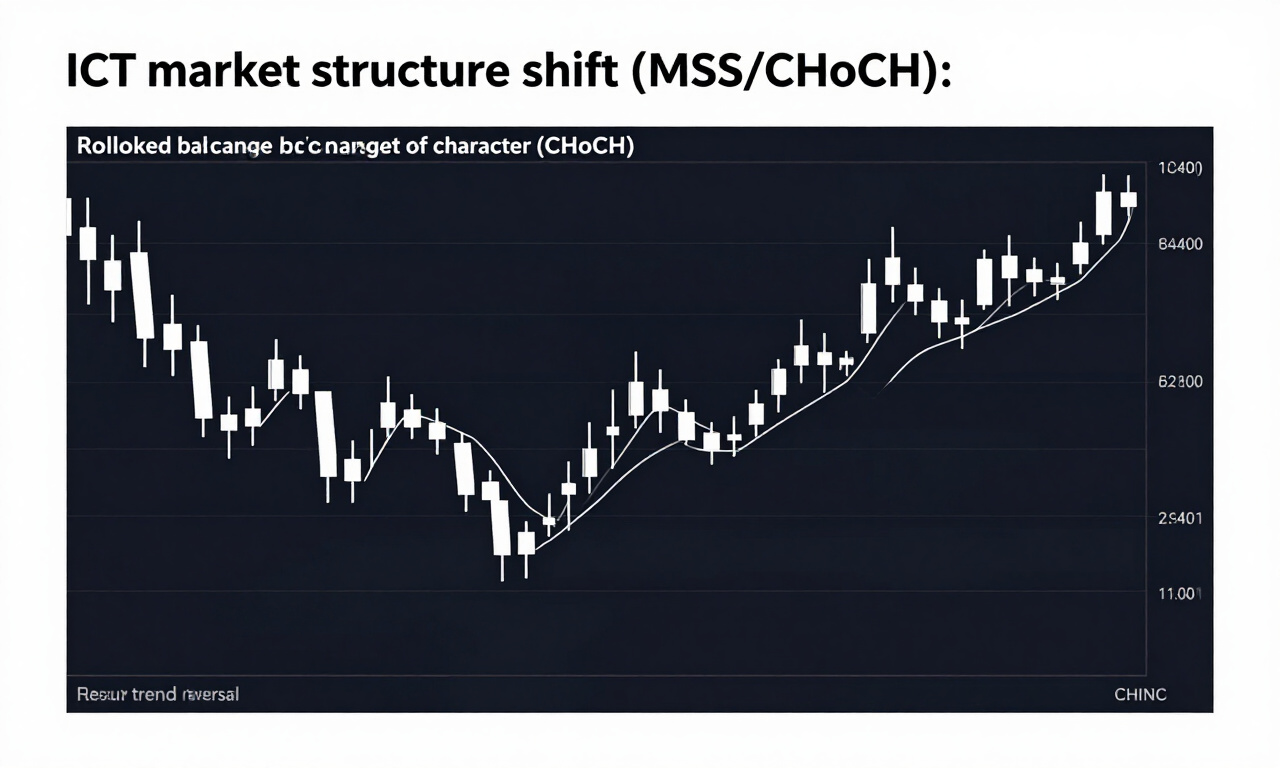
A Shift in Market Structure (MSS) or Change of Character (CHoCH) signifies a structural reversal when price breaks a protected high or low. This mechanical breach indicates that the institutional algorithm has exhausted liquidity in one direction and is initiating a move toward the opposing side of the current range.
Structure serves as the foundation for every ICT trade. Traders must distinguish between internal and external liquidity pools to avoid entering markets during consolidation phases. When price creates a swing high or low, it establishes a protected level. A breach of this level, followed by displacement, suggests that the market is re-pricing to seek liquidity elsewhere.
Key technical indicators of a structural shift include:
- Displacement: A rapid, high-momentum candle that breaks the previous structural high or low.
- Volume Confirmation: Institutional participation usually displays significant volume spikes during the breach.
- Retracement: Price does not move in a straight line; it returns to the mitigation zone or original order block.
Practitioners must recognize that not all structural breaks are valid. A true shift occurs only when the price closes beyond the wick of the previous structural extreme. If the price merely pierces the level and retracts, it often represents a stop-run rather than a trend reversal.
Practitioner Pro-Tip: Always look for a clean break. If the breakout candle is weak or contains significant wicks, the probability of a continuation move decreases significantly. Focus on the body closure.
The Mechanics of Fair Value Gaps (FVG) and Imbalance
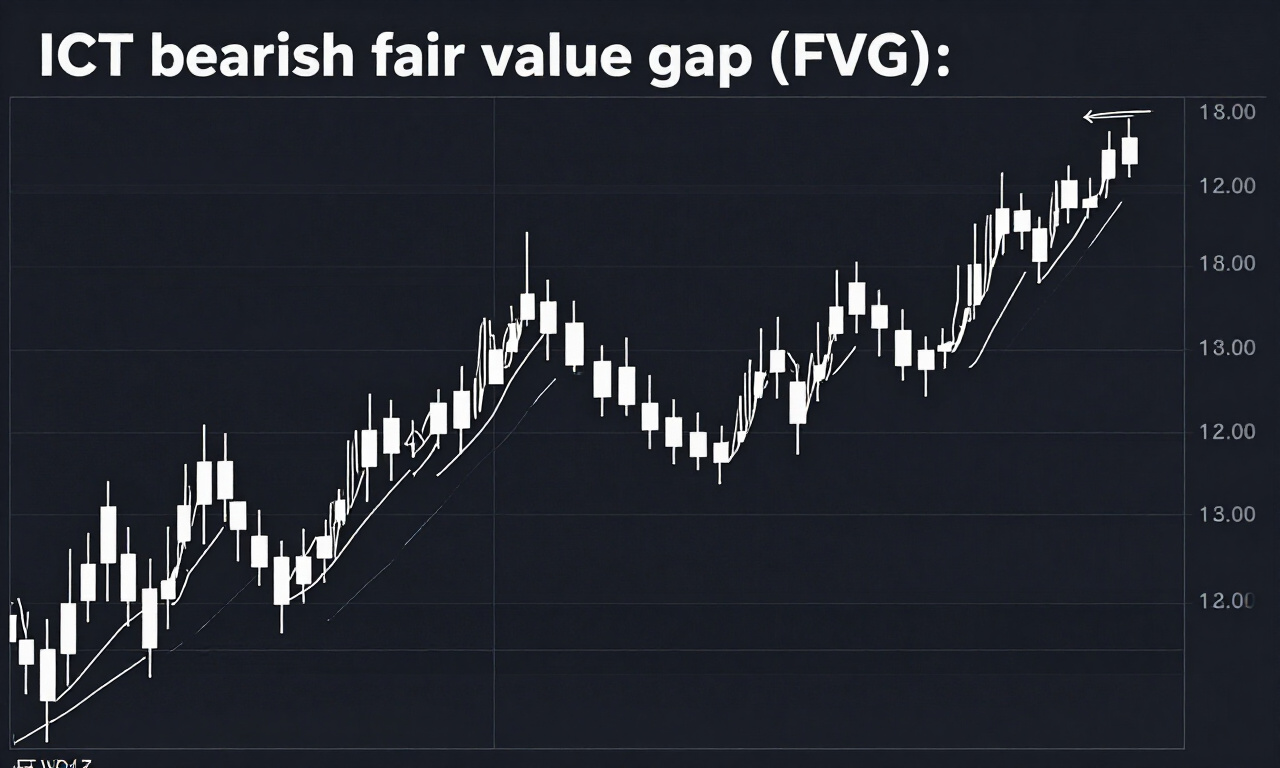
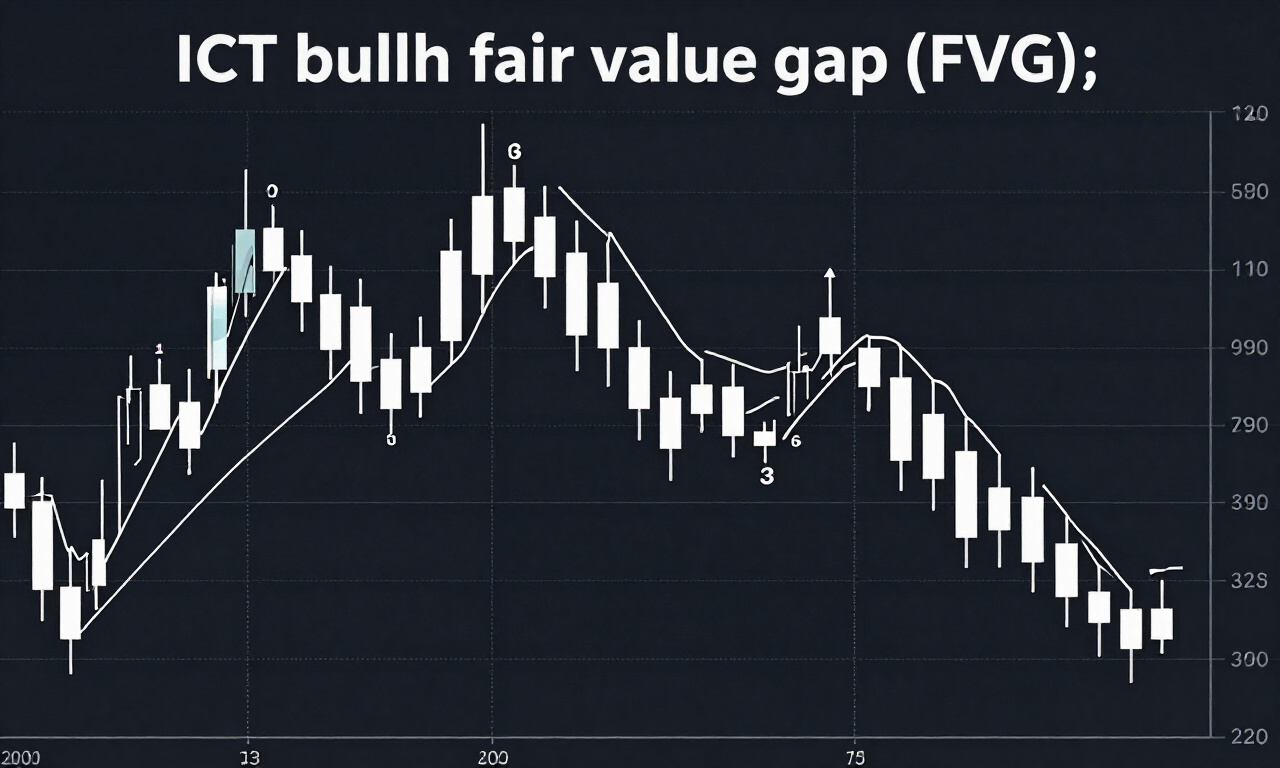
Fair Value Gaps are technical voids created when aggressive buying or selling activity prevents the market from trading at equilibrium price levels. These imbalances act as magnets, drawing price back to rebalance the order flow before the underlying market trend continues toward institutional liquidity targets or major order blocks.
The market seeks efficiency. When a large institutional order enters, price gaps often appear, leaving an area where only one side of the market was represented. These gaps, or imbalances, become high-probability entry zones. When identifying these, traders should look for a three-candle sequence where the first and third candle do not overlap.
Strategic utility of FVGs:
- Confluence: An FVG located near an order block or a Fibonacci golden pocket (0.618 to 0.786) provides a high-confidence trade setup.
- Targeting: Traders often use the opposing edge of an FVG as a profit-taking zone, as the market aims to fill these inefficiencies.
- Rejection: If price touches an FVG and fails to close inside, it often signals an aggressive rejection and immediate continuation of the trend.
The “inverted” Fair Value Gap (iFVG) occurs when a previously supportive FVG is breached by strong momentum. This conversion acts as a significant resistance level, signaling that the institutional bias has flipped. Understanding this transition is essential for traders looking to scale positions in trending environments during [currentyear].
Identifying and Trading Institutional Order Blocks
Order Blocks represent specific zones where institutional investors have placed substantial buy or sell limit orders. These areas are identified by the final opposing candle before a significant displacement occurs, serving as the origin point for the move and often functioning as support or resistance upon price return.
To identify a valid order block, look for the candle that precedes a rapid move away from the current price. For a bullish order block, this is the last down candle before a significant upward displacement. The institutional algorithm typically returns to this exact candle body to test the liquidity before continuing the expansion phase.
Evaluation criteria for order blocks:
- Liquidity Sweeps: The order block is most effective if it occurs after a stop-run on existing swing highs or lows.
- Time Priority: Order blocks on higher timeframes (H4, Daily) hold significantly more weight than those found on M1 or M5 charts.
- Unmitigated Status: Only trade order blocks that have not been “touched” or re-tested by subsequent price action.
While many traders mark the entire candle, the optimal entry point is often at the mean threshold of the order block or the edge of the candle body. Precision is critical. Placing stops just outside the high or low of the block ensures that you are invalidated only if the institutional premise is genuinely incorrect.
Applying ICT Order Blocks in [currentmonth]
Trading order blocks requires patience. You must wait for the price to return to the identified zone rather than chasing the market during an expansion. When price hits the block, do not enter blindly; wait for a lower-timeframe confirmation, such as a localized market structure shift or a micro-FVG formation. This approach significantly reduces the stop loss size while keeping the potential reward ratios high. In [currentyear], volatile currency pairs like GBP/JPY often provide these setups during the London session open. If the block fails to hold, recognize that as a signal that the market is targeting deeper liquidity, often leading to a stop run that creates an even stronger, deeper order block in the opposite direction.
Liquidity, Inducement, and Stop Runs
Inducement refers to retail-oriented price patterns designed to trap traders into positions before a liquidity sweep occurs. By placing their stop losses behind visible swing points, traders provide the liquidity necessary for institutions to execute their large positions, causing a stop-run before the actual trend direction commences.
Liquidity is the fuel of the market. Without it, institutional orders cannot be filled without causing extreme slippage. Retail traders are taught to trade double tops, double bottoms, and trendlines. These specific points are exactly where institutional algorithms seek liquidity.
Common liquidity traps:
- Trendline Liquidity: Price often breaks trendlines to induce shorts before ripping higher.
- Equal Highs/Lows: These are “sell-side” or “buy-side” liquidity targets that almost always get cleared.
- Asian Session Range: Often used as liquidity for the London breakout, where the range highs and lows are raided before the primary move.
When you see a “perfect” setup, assume it is an inducement. Ask yourself where the retail crowd has placed their stops. If the price moves directly toward those stops, you are likely looking at a target rather than a support zone. Only by identifying the inducement can you find the entry point for the “Smart Money” move.
Executing Trades During Liquidity Sweeps
The key to mastering liquidity sweeps is timing. Most institutional liquidity raids occur during the opening hours of major trading sessions, such as the London open or the New York open. If you identify a liquidity pool, wait for the sweep to conclude. A sweep is confirmed when price spikes into the liquidity zone and then immediately accelerates away in the opposite direction. This “v-shaped” price action is the footprint of a stop-run. Do not attempt to catch the falling knife; wait for the price to return to the area of the sweep, forming a fresh FVG or a new order block, and enter there. This method aligns your trade with the immediate reversal rather than the liquidity-seeking phase.
The Power of the Daily Bias and HTF Narrative
The Daily Bias determines the directional intent for the trading day, derived from the higher timeframe (HTF) market structure. By identifying whether the market is in a premium or discount zone, traders can forecast whether the primary move will be a buy-side or sell-side delivery during the session.
Before looking at your entry chart, analyze the daily timeframe. If the daily trend is bullish, your primary focus should be on finding buy-side setups within discount zones. Trading against the higher timeframe narrative is the most common reason for failed retail trades, even when individual ICT components are executed perfectly.
Determining the bias:
- HTF Objectives: Is the market reaching for a major weekly high or low?
- Relative Strength: Compare indices (like the DXY) against major pairs to see which is leading the move.
- Time of Week: Tuesdays and Wednesdays are often the days where the true weekly trend is established, while Mondays and Fridays are often consolidation or reversal days.
Recognizing premium versus discount zones is a critical skill. Draw your Fibonacci tool from the recent swing low to the swing high. Any price above the 0.50 level is a premium zone, where you should only look to sell. Any price below the 0.50 level is a discount zone, where you should only look to buy. Ignoring this simple rule often results in selling at the exact bottom of a move.
Synthesizing ICT Concepts into a Workflow
Successful trading is about a repeatable process, not luck. Begin your day by identifying the HTF liquidity targets. Once the target is found, look for an inducement pattern that leads to the target. Once the liquidity is swept, watch for a market structure shift on a lower timeframe. Following the shift, identify the resulting Fair Value Gap or Order Block. Finally, place your entry at the gap or block and your stop loss behind the structural pivot. This systematic approach, applied consistently throughout [currentyear], removes the emotional bias that plagues most market participants. Keep a trade journal of every liquidity sweep and mark your zones on the chart. Over time, you will start seeing the market algorithm’s patterns before they manifest as large price moves.
Frequently Asked Questions
This section covers the most common inquiries regarding the practical implementation and theoretical foundations of the ICT trading methodology, providing clarity on how to refine your entries and manage risk effectively using Smart Money Concepts in the current global market environment.
- What is the best timeframe for ICT trading?
The ICT framework works on any timeframe, but higher timeframes (H1, H4, Daily) are superior for identifying the overall market bias, while lower timeframes (M1, M5, M15) are ideal for refining precise entries and reducing stop loss size. - Why does price often ignore standard support and resistance?
Retail support and resistance levels are often used as liquidity pools. Institutional algorithms target these levels to trigger stop losses, providing the necessary volume to fill their large orders before moving in the opposite direction. - How do I avoid getting trapped by fakeouts?
Focus on the concept of displacement. A true institutional move is accompanied by strong, high-momentum candles and the creation of Fair Value Gaps. If the price drifts slowly toward a level, it is often a manipulation setup. - Can I combine ICT with other indicators?
ICT is a standalone methodology based on price delivery. Adding lagging indicators like RSI or MACD often creates conflicting signals, reducing the clarity of the institutional narrative you are attempting to follow.