

Mean reversion trading relies on the statistical observation that asset prices and historical returns eventually return to a long-term average or mean level. By identifying zones where price has stretched beyond its typical range, traders can anticipate a correction back toward equilibrium. This strategy functions best in markets showing clear consolidation or cyclical oscillation rather than aggressive trending patterns.
Successful implementation requires a firm grasp of institutional supply and demand zones, specifically how Rally-Base-Drop and Drop-Base-Rally structures create liquid order flow. When price deviates from these established equilibrium points, institutional traders often step in to rebalance positions, creating the localized reversals necessary for this high-probability approach to yield consistent results throughout [currentyear].
- Explore trading equilibrium channels in higher highs & lower lows market structure.
- Explore auditing supply and demand blocks in order flow trading guide.
- Explore timing mean reversion entries with overbought vs oversold indicators.
Understanding Mean Reversion Trading Principles
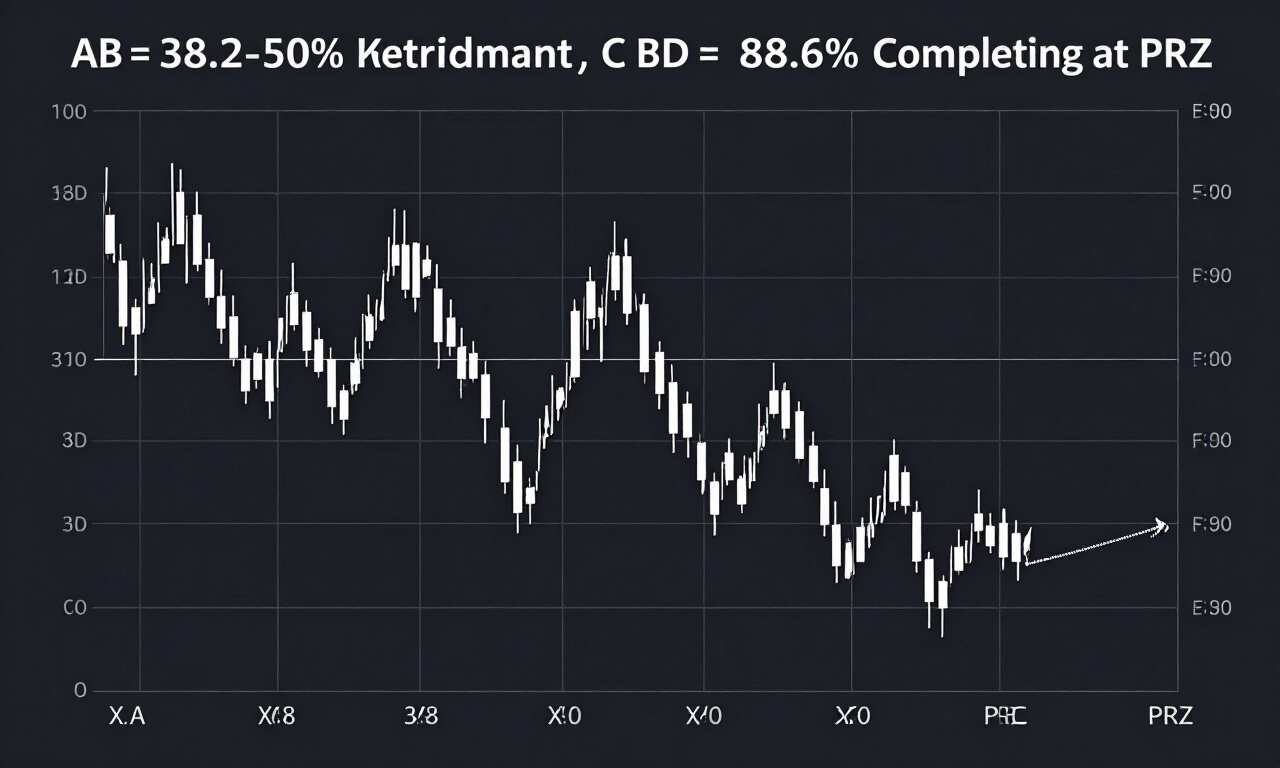
Mean reversion trading is a financial strategy based on the premise that price movements oscillating away from a central tendency, such as a moving average or equilibrium point, will eventually revert to that mean. Traders identify overextended conditions using oscillators, standard deviations, or institutional order blocks to anticipate these corrective price movements.
The core logic assumes markets exhibit a natural gravitational pull. When an asset price rises too far, too fast, it enters overbought territory. Conversely, deep drops create oversold conditions. Both scenarios suggest the prevailing momentum has exhausted its participants.
- The Mean: Typically calculated via 20-period to 200-period simple moving averages (SMA) or Bollinger Band midlines.
- Equilibrium: The price level where buying and selling pressure are roughly balanced, often found at the center of a historical trading range.
- Standard Deviations: Used to measure how far price has deviated from the average, providing objective exit and entry signals.
Institutional desks utilize this principle to minimize risk. By waiting for price to reach statistically significant extremes, they reduce the probability of catching a falling knife. This disciplined patience separates professional market participants from retail traders who frequently trade into the teeth of high-momentum breakouts.
Practitioner Pro-Tip: Never trade mean reversion in a breakout scenario. If a central bank releases unexpected interest rate data, the mean is often discarded by aggressive institutional buying or selling. Always correlate your reversion setup with broader market sentiment data.
Analyzing Supply and Demand Order Blocks
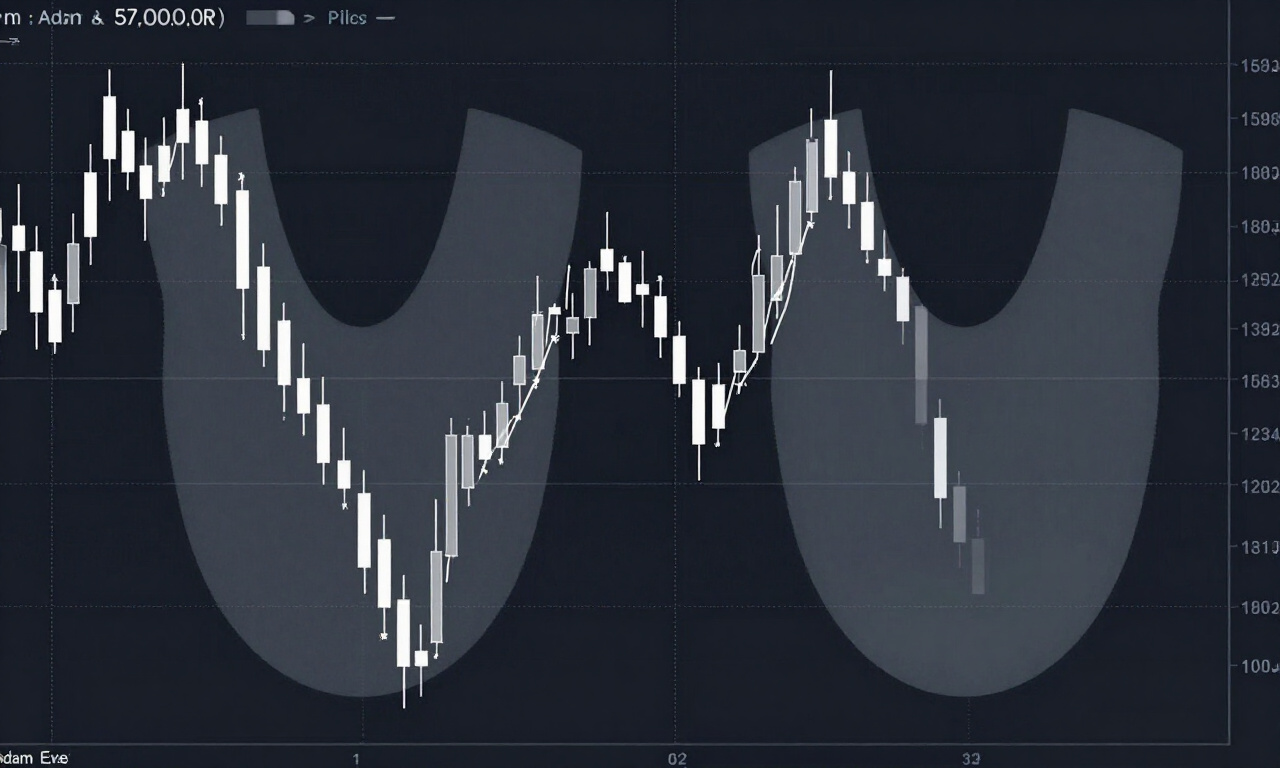
Supply and demand order blocks represent specific price levels where institutional market makers previously placed significant buy or sell orders. These blocks are categorized into Rally-Base-Drop and Drop-Base-Rally structures, acting as institutional footprints that traders monitor to determine where price will likely stall, reverse, or return to equilibrium.
Supply zones consist of selling pressure, while demand zones comprise buying liquidity. These areas are not just lines on a chart but zones where institutional algorithms operate. When price touches these zones after an impulsive move, it often experiences a rapid reaction as pending orders are triggered.
Rally-Base-Drop (Supply Zones)
Rally-Base-Drop patterns form when an upward trend experiences a period of consolidation followed by an aggressive decline, signaling that institutional sellers have overtaken buyers at a specific price level. This creates a supply zone, a critical area where traders expect the price to encounter resistance upon its return.
The “Base” represents the battleground where the market paused before the institutional sell orders pushed the price down. When price retraces back into this base, supply exceeds demand, leading to a potential reversal. Traders look for a sharp exit from the base to confirm the zone’s strength. If the price drifts slowly back into the zone, the supply might already be depleted. High-volume candles exiting the base are the gold standard for identifying valid supply.
When incorporating this into mean reversion, you wait for the price to move away from the mean and hit an established Rally-Base-Drop zone. The convergence of a statistical overextension and a confirmed supply zone significantly increases the win rate of the trade. Always check for the presence of unmitigated orders.
Drop-Base-Rally (Demand Zones)
Drop-Base-Rally patterns function as the inverse of supply zones, occurring when price declines into a consolidation base before surging upward with significant volume. This structure establishes a demand zone where institutional buyers are waiting to absorb sell orders, creating an ideal area for initiating long mean reversion positions.
Identifying these zones requires visual discipline. You are looking for a clear shift in momentum. The “Drop” is the initial move that traps retail traders, the “Base” is the institutional accumulation phase, and the “Rally” is the institutional mark-up. Once the rally is confirmed, the base level remains a high-interest area for future price action.
In a mean reversion context, focus on instances where price drops away from the mean and enters a fresh Drop-Base-Rally zone. The institutional presence within the base acts as a buffer. Even if the broader trend is slightly bearish, the strength of the demand zone often forces a short-term correction back toward the mean, providing the desired profit target for the mean reversion trader.
Risk management is paramount here. Place your stop-loss just outside the base structure. If the price breaks through the base, the institutional demand is exhausted or nullified, and the trade thesis is invalidated. Maintaining a strict stop-loss prevents minor range breaks from turning into major portfolio drawdowns during volatile periods in [currentmonth].
Executing Trades in Ranging Markets
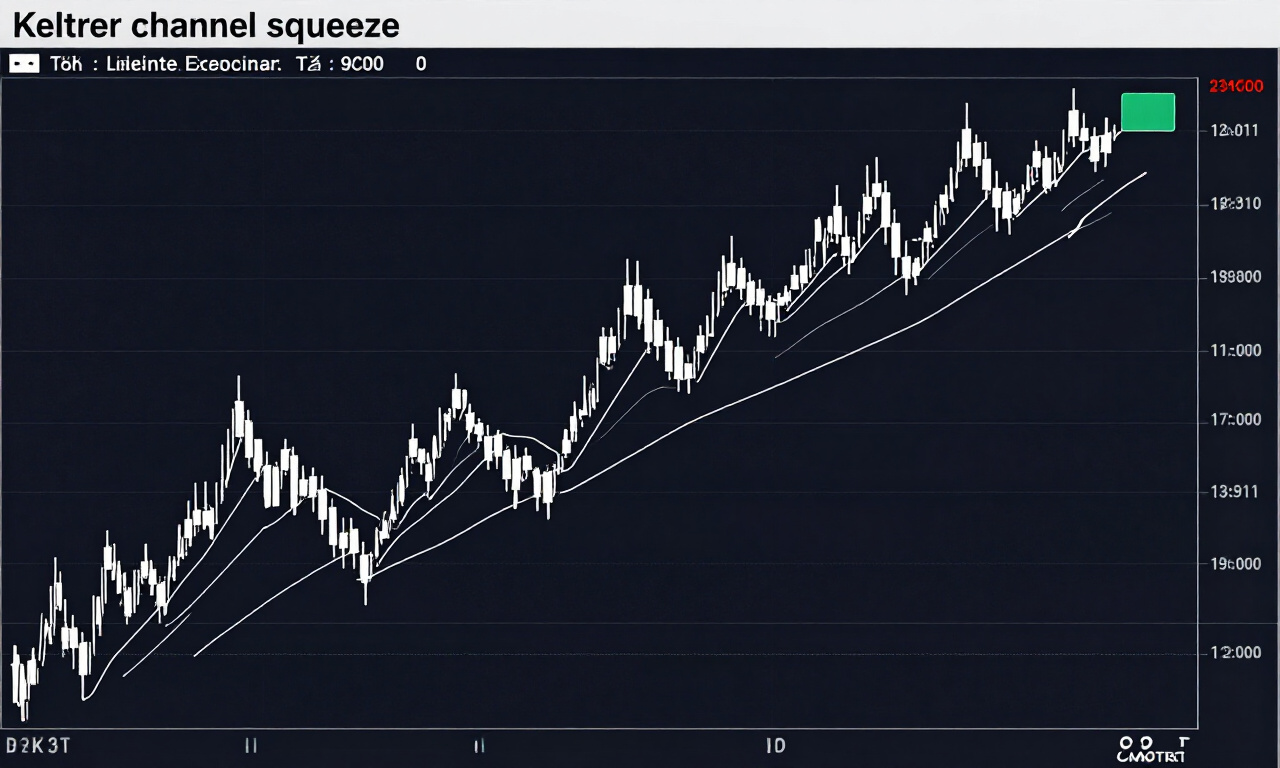
Ranging markets provide the optimal environment for mean reversion, as price effectively oscillates between established support and resistance levels without a definitive trend. Traders utilize these predictable bounds to enter positions at the extremes, aiming for the equilibrium center where the asset value is deemed fair by the market.
During a range, the market lacks a clear directional bias. This absence of trend is where mean reversion thrives. By ignoring the impulse moves that suggest a breakout, you stay within the confines of the established channel. This is the time to employ oscillators like the Relative Strength Index (RSI) or Stochastic to identify timing.
Range-bound strategies involve:
- Identifying the Extremes: Locate the highest resistance and lowest support levels that have been tested at least twice.
- Calculating Equilibrium: Find the midpoint between these two extremes. This is your primary profit-taking zone.
- Entry Timing: Wait for price to touch the extreme and show a signs of exhaustion (rejection candles) before entering.
Remember that ranges are temporary. Eventually, a range will lead to a breakout. A professional trader recognizes when the range has been tested too many times, as the probability of a breakout increases with each touch. Avoid trading the extremes once the volume starts increasing significantly, as this suggests the range is about to fail.
Integrating Equilibrium into Your Strategy
Equilibrium represents the fair value of an asset where supply and demand are in parity, serving as the target for mean reversion strategies. By identifying this anchor point within a market structure, traders can effectively gauge whether an asset is currently mispriced and set realistic targets for price convergence.
Equilibrium is not static. In a trend, the equilibrium point follows the moving average. In a range, it is fixed. Successful traders adapt their perspective based on the market regime. When the market transitions from a range to a trend, the equilibrium point shifts, requiring the trader to update their technical markers accordingly.
One common mistake is aiming for the absolute top or bottom. A seasoned practitioner knows that the real edge is found in the move back toward the middle. By taking profits at the equilibrium, you avoid the risk of price reversing again before it hits the other side of the range. This incremental approach builds consistent equity growth.
Always align your trades with the timeframe you are analyzing. A 15-minute range has a different equilibrium than a weekly range. High-timeframe equilibrium levels carry much more institutional weight and should be prioritized in your overall strategy. If a 15-minute mean reversion setup aligns with a weekly equilibrium point, the probability of success increases dramatically.
Frequently Asked Questions
How do I distinguish between a valid supply zone and a random price swing?
Valid supply zones, such as Rally-Base-Drop structures, feature a strong, impulsive move away from the base with significant volume. Random swings lack this intensity and often fail to produce a sustained price reaction when retested. Always look for the institutional “imbalance” created during the initial move away from the zone.
Is mean reversion safer than breakout trading?
Mean reversion is generally considered to have a higher win rate in sideways markets, but it requires precise timing at extremes. Breakout trading offers greater explosive potential but often carries lower win rates due to false signals. Success in either style depends on the specific market context, not just the strategy choice.
Can I use mean reversion in highly volatile news events?
Mean reversion strategies are typically high-risk during major news events. Economic reports often create liquidity voids that cause price to overshoot normal ranges, rendering standard deviation or moving average calculations unreliable. It is safer to remain sidelined until volatility stabilizes and the market establishes a new, clear structure.
What is the best indicator for identifying market equilibrium?
While moving averages are standard, many professionals prefer the Volume Profile. The Point of Control (POC) identifies the exact price level where the most volume has traded over a specific period, making it the most accurate statistical representation of equilibrium. Use it alongside price action to refine your entries.