

Navigating the boundary between market exhaustion and trend continuation represents the primary challenge for professional currency traders. When analyzing oversold vs overbought conditions, traders must distinguish between genuine reversal signals and simple momentum pauses within a strong directional move. This guide evaluates how institutional-grade oscillators, specifically the Relative Strength Index and Stochastic Oscillator, function as diagnostic tools for market volatility. We analyze the mathematical thresholds that dictate mean reversion opportunities while emphasizing the necessity of integrating multi-timeframe analysis. By understanding the underlying physics of price momentum, practitioners can move beyond basic overbought readings and identify high-probability entries that align with broader institutional liquidity flows across 2026. Through technical precision and disciplined risk management, we refine the application of these oscillators to filter out noise, providing a clearer view of exhaustion points in volatile forex markets during October.
- Explore evaluating oscillator bands in Traders Dynamic Index (TDI) indicator guide.
- Explore measuring momentum conviction in Relative Vigor Index (RVI) guide.
- Explore comparing oscillators in best indicators for forex trading.
Defining Oversold vs Overbought Market Dynamics
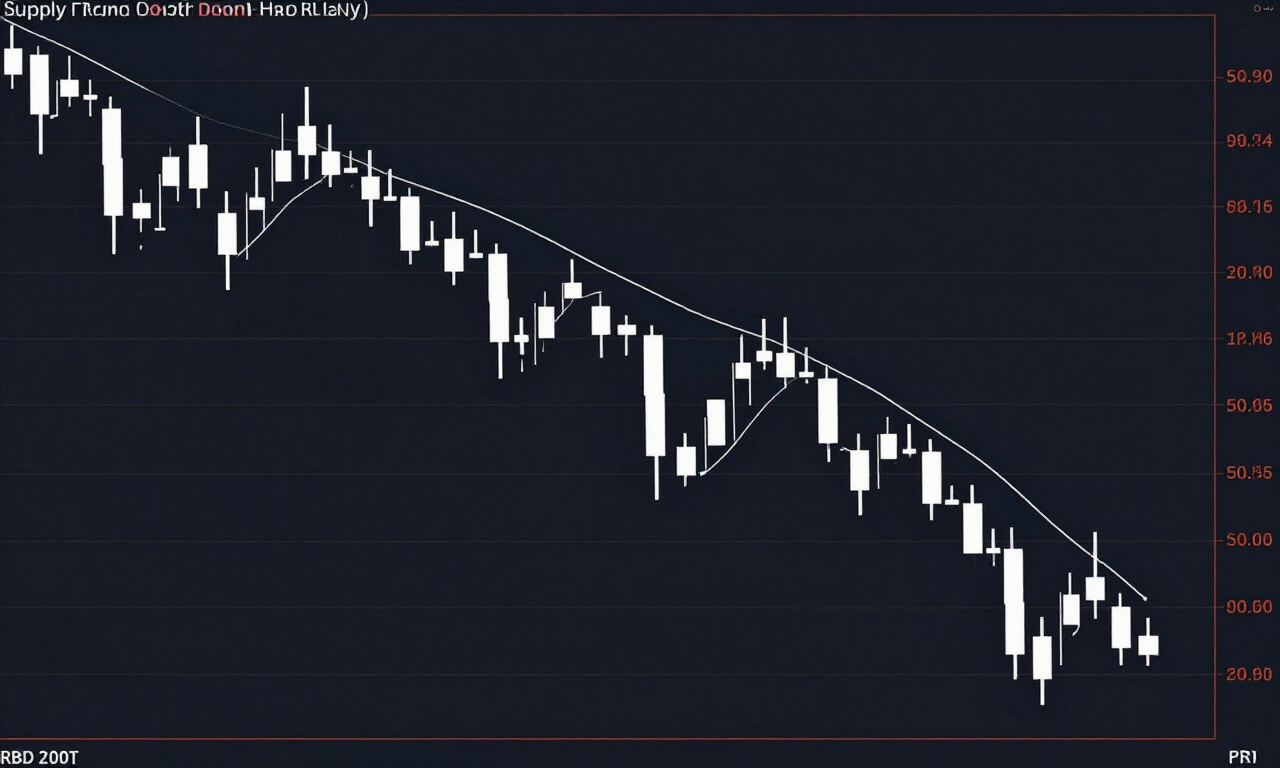
Overbought and oversold conditions identify extremes in price momentum where assets reach unsustainable levels relative to recent trading ranges. Overbought states suggest buying exhaustion and potential downside corrections, whereas oversold states indicate selling pressure has peaked. These signals rely on oscillator thresholds that measure the velocity of directional price movement.
The core concept of market equilibrium relies on the mean reversion principle. When price deviates significantly from its historical average, oscillators like the RSI begin to signal that the asset is stretched. However, professional traders recognize that an overbought reading does not automatically trigger a sell order.
In a healthy trend, assets frequently dwell in overbought territory for extended durations. This phenomenon occurs because strong institutional buying continues to drive price action despite technical exhaustion. Traders often commit errors by fading these moves without confirming a structural break in market sentiment or price action.
Practitioner Pro-Tip: Never trade an oversold or overbought reading in isolation. Always confirm the oscillator state with a corresponding pivot point or a failure swing on the price chart to ensure the momentum is truly exhausted rather than just resting.
Distinguishing between a range-bound market and a trending market is essential. In sideways conditions, oscillators behave with high predictability. In trending markets, they serve as sentiment barometers. Understanding this difference prevents premature entries against the prevailing flow of liquidity.
Relative Strength Index (RSI) Mechanics
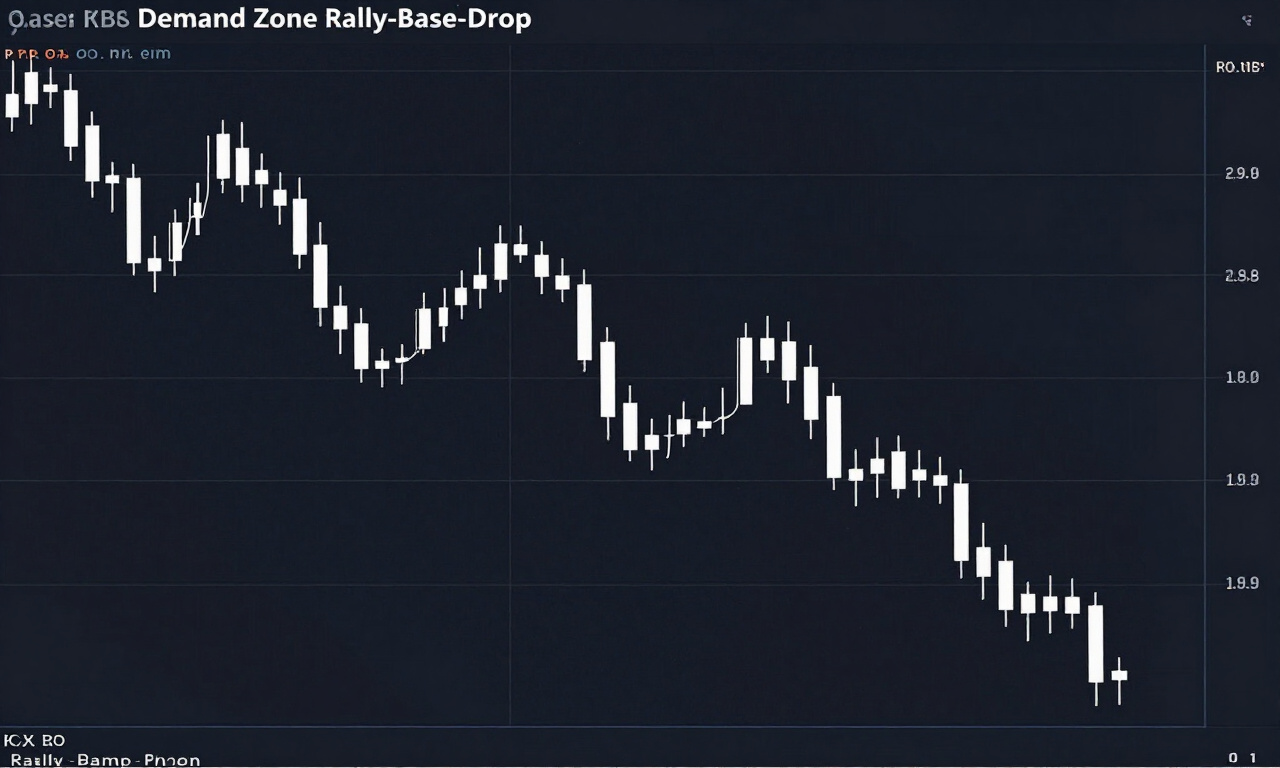
The Relative Strength Index serves as a momentum oscillator measuring the speed and magnitude of recent price changes to evaluate current valuation. It oscillates between zero and one hundred, with seventy typically marking overbought conditions and thirty identifying oversold states. Precise RSI calibration remains vital for effective signal generation.
Standard RSI settings use a 14-period look-back, which provides a balance between sensitivity and noise reduction. For intraday traders, shortening this period to 9 or 7 increases the frequency of signals but introduces significant false positives during volatile news events. Traders must adjust these inputs based on specific asset volatility.
When the RSI breaks above 70, the market is technically overextended. This indicates that the buying momentum is aggressive, yet it also warns that the pool of new buyers is thinning. Conversely, an RSI reading below 30 identifies a state of extreme fear where selling pressure has reached a logical exhaustion point.
- Standard Calibration: 14-period RSI for major pairs like EUR/USD.
- Aggressive Calibration: 9-period RSI for high-volatility pairs like GBP/JPY.
- Trend-Filtered RSI: Adjusting thresholds to 80 and 20 during strong directional moves to avoid early exits.
Divergence analysis remains the most robust application of this indicator. When price hits a new high but the RSI creates a lower high, the resulting bearish divergence acts as a warning sign. This discrepancy between price and momentum often precedes a significant market correction or a shift in trend direction.
Applying RSI for Trend Continuation
RSI trend continuation strategies focus on identifying momentum resets during strong directional moves instead of predicting reversals. When price trends strongly, the RSI often holds between 40 and 80 for bullish trends, or 20 and 60 for bearish trends, providing clean entry points during shallow pullbacks.
Traders often fail by assuming RSI must touch 70 or 30 for a signal. In a powerful bull market, the RSI may retreat to the 40-50 level. A bounce from this area indicates that buyers remain in control and the previous trend is resuming. This is where professional volume analysis proves critical.
Combining this with a 50-period exponential moving average allows for a comprehensive filter. If the price remains above the moving average and the RSI bounces off the 40 support line, the probability of a successful continuation trade increases. This approach prevents entering counter-trend positions prematurely.
Stochastic Oscillator Analysis
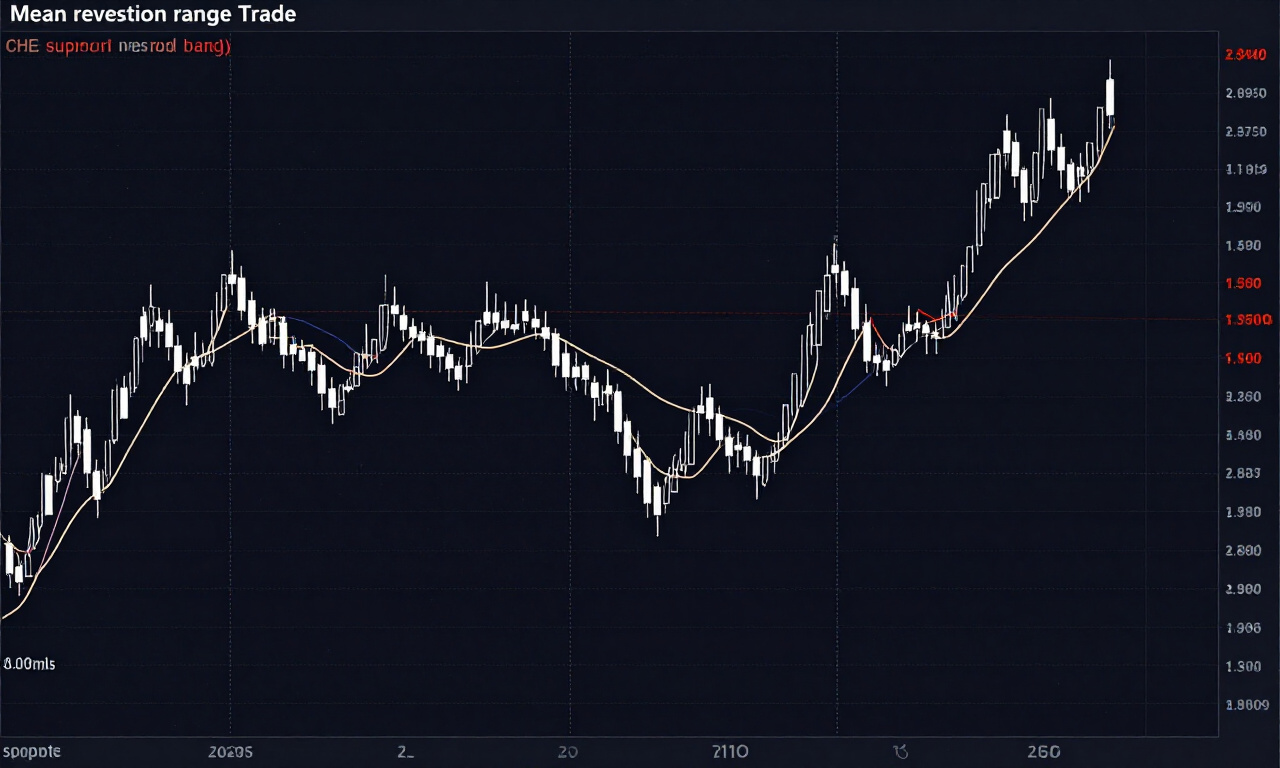
The Stochastic Oscillator determines the location of the current close relative to the high-low range over a specified period. It utilizes two lines, %K and %D, to identify overbought and oversold zones. Crosses between these lines generate specific buy and sell triggers within the defined threshold levels.
Unlike the RSI, which measures velocity, the Stochastic Oscillator measures relative position. This makes it highly responsive to quick price swings within a range. The standard 14, 3, 3 configuration is the industry default, providing a reliable baseline for identifying short-term exhaustion in currency markets.
A reading above 80 defines the overbought zone, while a reading below 20 defines the oversold zone. When the fast %K line crosses below the slow %D line while both are in the overbought zone, it generates a bearish signal. This interaction represents a classic momentum crossover.
Practitioner Pro-Tip: Pay close attention to the angle of the lines. A steep angle during a crossover indicates high-momentum rejection, whereas a shallow, horizontal crossover suggests market hesitation and a potential lack of follow-through.
Practitioners should observe how the Stochastic behaves during ranging cycles versus trending ones. In range-bound markets, the Stochastic provides clean signals for buying at the bottom and selling at the top. In trending markets, look for the Stochastic to stay locked in the overbought or oversold territory for extended durations.
Utilizing Stochastic Divergence
Stochastic divergence occurs when the price registers a new extreme while the oscillator fails to confirm the move, signaling a loss of momentum. Bullish divergence happens at the lows, while bearish divergence appears at the highs, acting as a warning of an imminent shift in market direction.
Divergence is not a direct entry signal but rather a condition for observation. When a bearish divergence appears on the H4 timeframe, traders look for a breakdown in market structure on the H1 timeframe. This multi-timeframe approach ensures that the divergence is backed by a shift in supply and demand zones.
Volume confirmation remains the final piece of the puzzle. If the Stochastic shows bearish divergence and price fails to break a key resistance level on lower volume, the likelihood of a reversal is amplified. Traders should always wait for the candlestick to close before acting on these signals.
Combining Indicators with Price Action
Integrating overbought vs oversold oscillators with raw price action analysis filters out erratic signals and validates high-probability setups. Indicators provide context, but structural levels like support and resistance dictate the actual entry. This synthesis creates a disciplined environment for executing trades based on institutional logic and mathematical probability.
A common mistake involves relying solely on indicator values. Instead, treat the indicator as a background check for the current price environment. If the price reaches a major psychological level or a previously tested support zone, and the indicator hits an oversold state, the setup quality improves significantly.
Institutional traders use these signals to locate “value” areas. An oversold reading on a lower timeframe during a major structural pullback provides a precise entry point for traders looking to align with the dominant trend. By waiting for the price to reach a confluence of support and momentum exhaustion, risk is minimized.
- Confluence Check: Does the oversold level align with a Fibonacci retracement?
- Pattern Check: Is there a bullish engulfing candle or pin bar forming at this level?
- Structural Check: Is the market structure still intact for a bullish move?
Risk management is paramount when playing these reversals. Since reversals can often fail, traders should place stop-losses just beyond the recent swing high or low. If the price fails to hold the support zone, the thesis is invalidated, and the trade should be closed regardless of what the oscillator suggests.
Frequently Asked Questions
This section clarifies common misconceptions regarding momentum oscillators and their practical application in 2026. Understanding these nuances prevents costly errors for traders of all skill levels, ensuring that technical analysis is applied with logic rather than assumption. These answers focus on the intersection of indicators and market reality.
Does an overbought signal mean the price will fall immediately?
An overbought signal indicates that buying pressure has been intense over a specific period. It does not guarantee an immediate reversal, as strong trends can sustain overbought conditions for significant durations. Always wait for a structural change in price action before initiating a short position based on an overbought reading.
Which RSI setting is most accurate for swing trading?
The 14-period RSI remains the industry standard for swing trading. It provides a balanced view that filters out short-term market noise while highlighting meaningful shifts in momentum. While traders may experiment with different lengths, the 14-period setting aligns with the largest pools of liquidity and historical market data.
Can I trade oversold conditions in a strong downtrend?
Trading against a strong downtrend by buying the oversold dip is dangerous. It is more effective to treat oversold signals during a downtrend as opportunities to look for short positions at better prices once the momentum reset completes. Avoid counter-trend trading unless you have strong confluence from multiple technical tools.
How does volatility impact the effectiveness of oscillators?
High volatility often causes oscillators to pin against their limits, leading to frequent signals that lack substance. In volatile environments, increase the period length of your indicator to smooth out the data, or combine the oscillator with a volatility-adjusted tool like the Average True Range to measure the intensity of the moves.