
The Traders Dynamic Index, commonly known as the traders dynamic index, remains one of the most robust multi-dimensional tools for technical analysis in the retail forex landscape. Developed by Dean Malone, this composite indicator merges Relative Strength Index (RSI) momentum, market volatility via Bollinger Bands, and trend direction through moving averages into a single oscillator window. Unlike standalone oscillators that frequently yield lag-heavy signals, the indicator provides a comprehensive snapshot of market health. Traders utilize this system to identify trend exhaustion, price reversal zones, and volatility contractions simultaneously. By isolating the interaction between the RSI price line and the volatility bands, practitioners generate high-probability entries that align with institutional market flow. Mastering the calibration of these components for [October] 2026 requires a focus on signal confirmation rather than blind indicator reliance, ensuring that every trade execution adheres to strict risk management protocols.
Successful implementation of the traders dynamic index requires a foundational understanding of its constituent parts. When price momentum accelerates, the distance between the volatility bands expands, signaling a strong trend. Conversely, a tightening of these bands indicates a period of market consolidation. This article breaks down the technical configuration required to optimize the indicator for modern trading environments.
- Explore pairing TDI volatility bands with the Relative Vigor Index (RVI) guide.
- Explore exploring trend tools in best indicators for forex trading.
- Explore evaluating oscillator extremes in overbought vs oversold indicators.
Understanding the Traders Dynamic Index Architecture
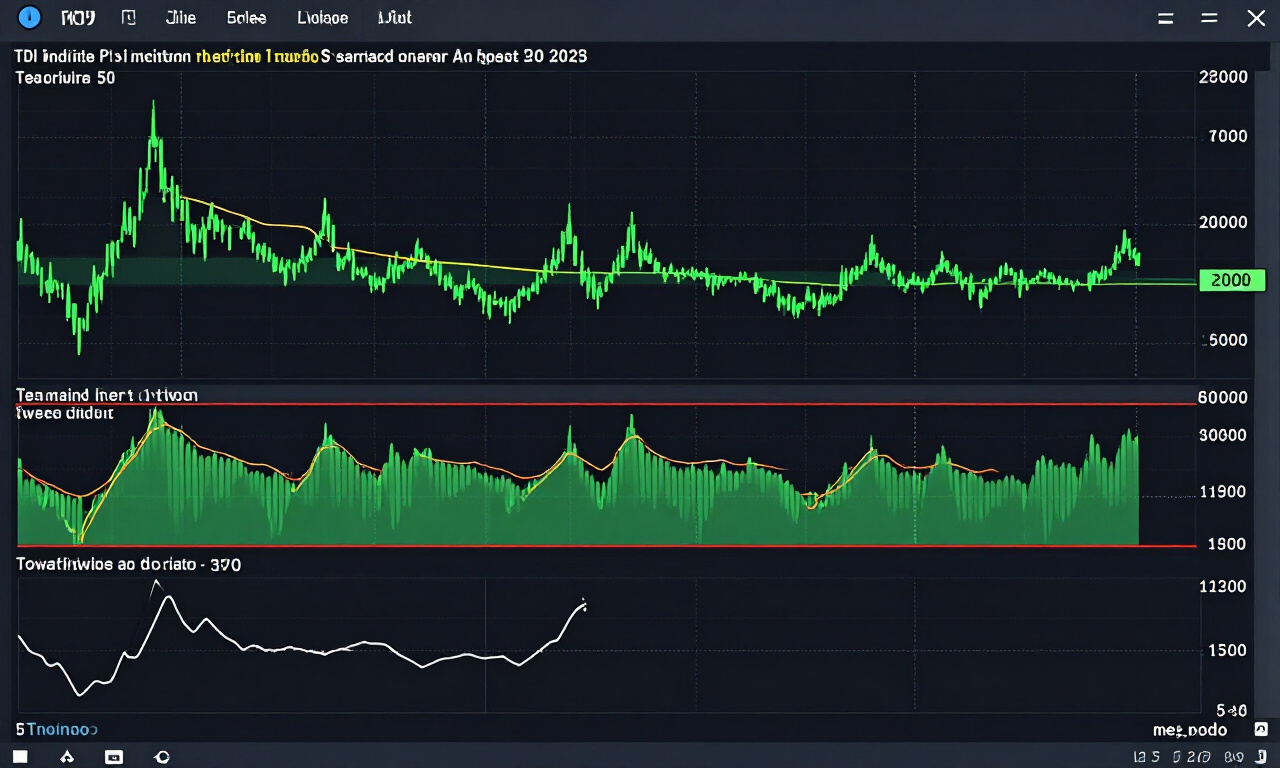
The traders dynamic index serves as a comprehensive visual representation of market momentum, volatility, and trend direction. It integrates an RSI baseline, a signal line, and market volatility bands derived from Bollinger Band calculations. This multi-layered approach allows market participants to filter out market noise and identify high-probability reversal points.
At its core, the indicator is built upon a 13-period RSI applied to the market price. The secondary lines represent the volatility of this RSI. When the RSI line crosses above the signal line while remaining within the bands, it suggests increasing bullish momentum. Traders look for specific patterns such as the “TDI cross” to initiate positions.
Volatility bands play a critical role in determining if a trend has reached its limit. When the RSI price line touches the upper or lower volatility bands, it suggests the market has become overextended. This is a common trigger for mean reversion strategies, where the price is expected to pull back toward the mean.
Practitioner Pro-Tip: Never trade the indicator in isolation. Always cross-reference the signal with major support or resistance zones identified on your primary price chart to ensure your setup aligns with historical liquidity levels.
Optimizing MT4 and MT5 Settings
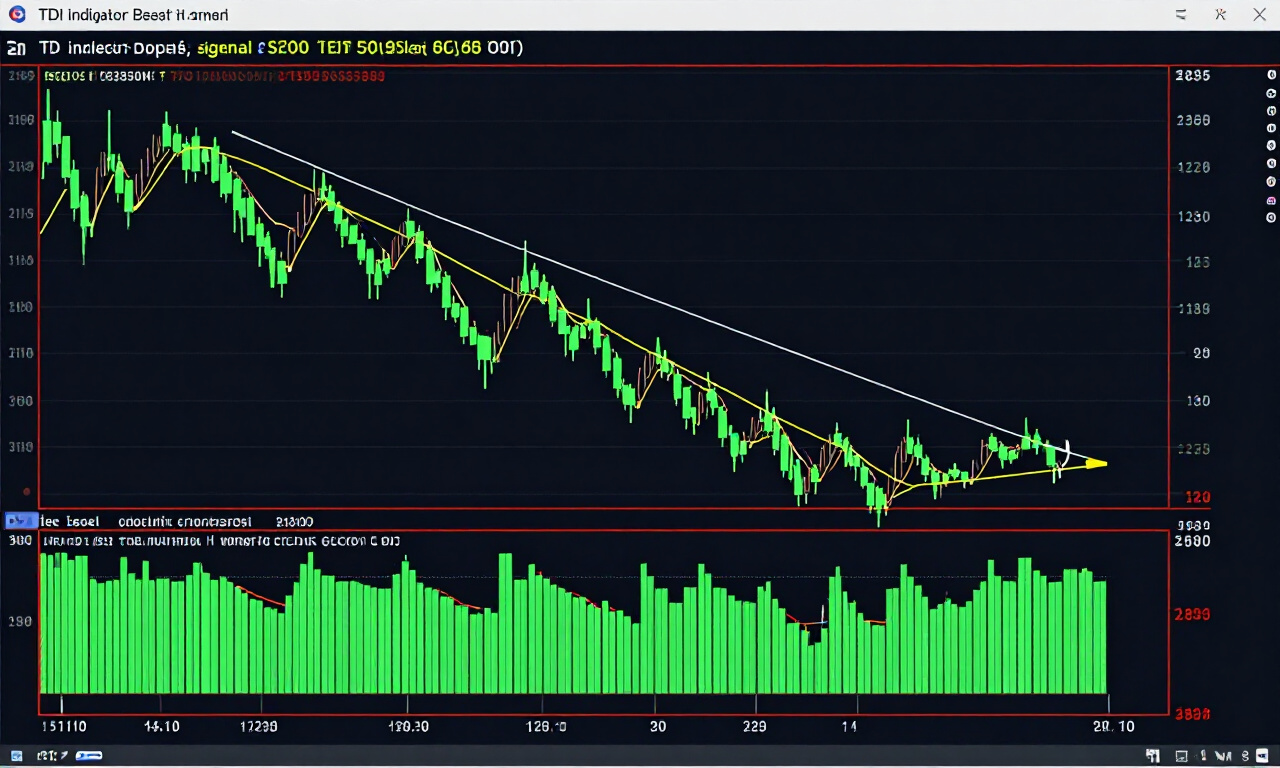
Configuring the traders dynamic index for optimal performance requires precise parameter adjustments to match current market conditions. Standard settings typically utilize an RSI period of 13 and a signal line period of 2. For traders focusing on intraday volatility, adjusting these periods can provide faster signals for shorter timeframes.
- RSI Period: 13 (The standard for measuring medium-term momentum).
- Volatility Band Period: 34 (Used to calculate the standard deviation for the bands).
- Signal Line: 2 (Provides rapid feedback on current RSI direction).
- Trade Filter: Incorporate the 200 EMA to ensure trades follow the dominant macro trend.
When installing the indicator on MT4 or MT5, ensure your background contrast allows for easy visualization of the five lines. The RSI line, often colored green, should be the most visible. The signal line, typically red, acts as the primary trigger for entries. The volatility bands (the outer lines) serve as your exit guides or exhaustion warnings.
If you find that the indicator is producing too many false signals during periods of low liquidity, consider increasing the RSI period to 21. This adjustment will smooth out the line and filter noise, though it may result in slightly delayed entries. Always verify your broker’s server time to ensure your session-based analysis is accurate for the local market open.
Trend Following Strategies
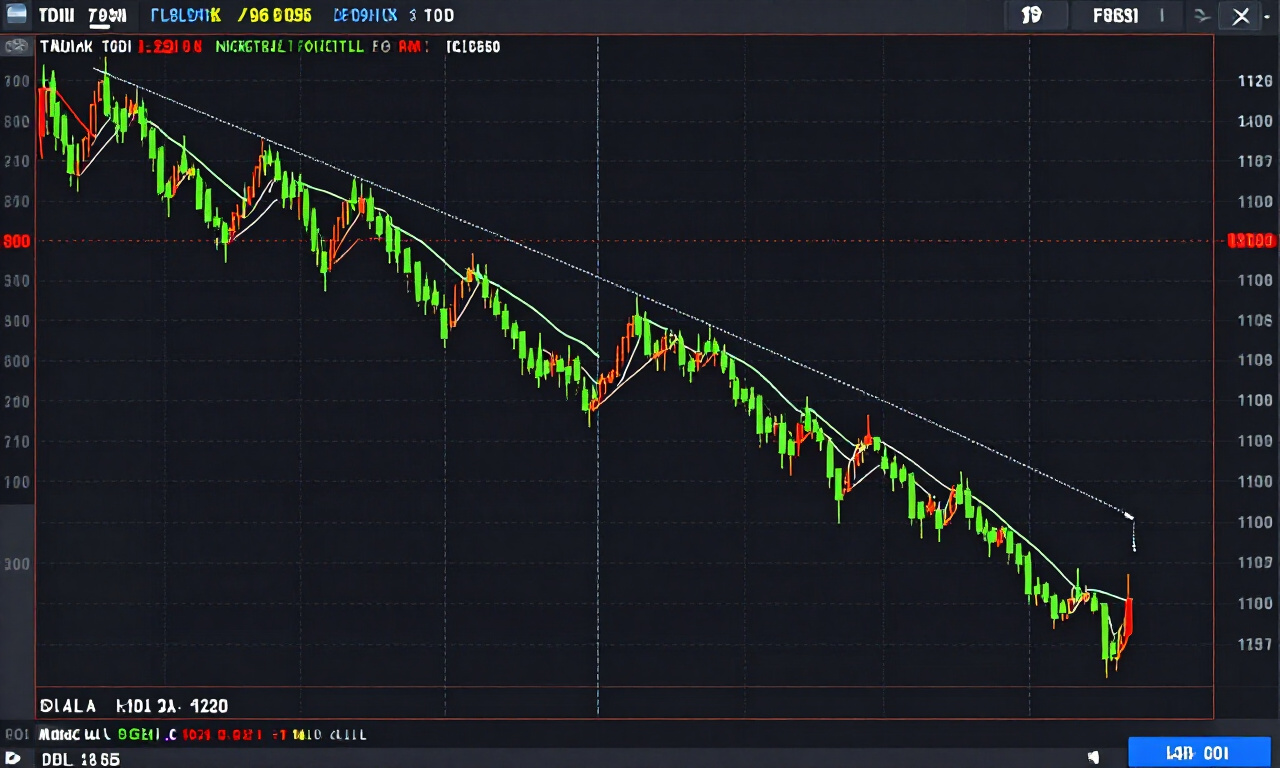
Applying the traders dynamic index for trend following involves waiting for the RSI line to maintain a steady trajectory above or below the signal line. Traders prioritize entries where the RSI price line remains within the upper or lower half of the volatility bands, signifying consistent directional momentum rather than exhaustion.
In a strong uptrend, the RSI line will often hover above the signal line, and both will reside in the upper half of the Bollinger Band range. This indicates that buyers are in control and the volatility is supporting the upward move. Traders should avoid shorting the market until the RSI line crosses decisively below the signal line.
Patience remains the greatest asset when using the traders dynamic index in trend-following modes. Many novices make the mistake of exiting as soon as the RSI hits the upper band during a strong trend. However, a strong trend can “walk the bands,” where the RSI line stays near the outer boundary for an extended duration. Wait for the signal line cross before closing a profitable position.
Mean Reversion and Exhaustion Trades
The traders dynamic index excels at identifying market exhaustion through its volatility bands. When the RSI line hits or breaches the outer volatility bands, the market is often considered overbought or oversold. This signal frequently precedes a return to the mean, offering high-reward opportunities for contrarian traders.
To execute a mean reversion trade, monitor the RSI line as it approaches the outer bands. If the price action on the candlestick chart also shows signs of hesitation, such as a pin bar or engulfing pattern, the probability of a reversal increases significantly. The entry occurs when the RSI line reverses direction and crosses back over the signal line.
Stop-loss placement is critical here. Place your stop just beyond the recent swing high or swing low. Because you are trading against the immediate momentum, the stop-loss must be protected by the actual market structure, not just the indicator readings. Target the middle of the volatility bands (the baseline) for your first partial exit.
Practitioner Pro-Tip: Use the “baseline” (usually the 34-period SMA of the RSI) as your trailing stop. If the RSI line closes on the opposite side of this baseline, the momentum has likely shifted, and it is time to exit the trade regardless of profit.
Combining with Price Action Analysis
Integrating the traders dynamic index with pure price action creates a holistic trading system that accounts for both internal momentum and external market structure. Traders should never rely solely on indicator crossovers. Instead, they must confirm every crossover event with a structural break in price or a retest of a significant level.
Consider a scenario where the indicator shows a bullish crossover. If this happens while the price is testing a previous resistance level that has now turned into support, the confluence of these two factors creates a high-probability buy signal. This method reduces the number of trades taken but increases the win rate significantly.
Institutional liquidity zones are another essential confirmation factor. Use your charts to mark areas where large orders historically resided. If the indicator signals an exhaustion trade precisely as the price tags a major supply or demand zone, you are trading in alignment with the “smart money” flow. This creates a clear objective for risk management.
Risk Management Protocols
Implementing strict risk management when using the traders dynamic index protects against the inherent lag of indicator-based systems. Every trade entry should be calculated to risk no more than one to two percent of the total account equity, with specific stop-loss distances determined by the current volatility as shown by the bands.
When volatility is high, the bands on the indicator widen significantly. This is a visual cue that the market environment requires a wider stop-loss to account for standard market fluctuations. Conversely, during periods of consolidation, the bands tighten, allowing for tighter stops and higher potential reward-to-risk ratios on breakouts.
- Set stop-losses based on Average True Range (ATR) values to account for volatility.
- Use a minimum 1:2 risk-to-reward ratio for all entries.
- Scale out of positions as the RSI line approaches the opposite volatility band.
- Avoid trading during high-impact news events where indicator signals can become erratic.
The traders dynamic index is a powerful tool, but it cannot predict fundamental shifts in market sentiment caused by economic data releases. Always consult an economic calendar before executing trades, and stay out of the market during the release of major interest rate decisions or non-farm payroll reports.
Advanced Divergence Analysis
Divergence between price action and the traders dynamic index provides some of the most reliable reversal signals in the market. When the price makes a new high but the RSI line fails to surpass its previous high, it indicates weakening momentum, often signaling a shift in trend direction is imminent.
This “hidden” divergence works exceptionally well in both bull and bear markets. To spot it, compare the peaks of the RSI line with the peaks of the price candles. If they move in opposite directions, you have a divergence. The traders dynamic index makes this easier to spot than a standard RSI because the signal line acts as a filter for the move.
Patience is required to let the divergence fully develop. Many traders jump in early as soon as they see the start of a divergence. Instead, wait for the RSI line to cross back across the signal line after the divergence has been confirmed. This extra step ensures that you have a confirmation that the reversal is actually occurring.
Managing Trade Exits Effectively
Exiting trades at the right moment is as important as the entry when utilizing the traders dynamic index. Effective exit strategies involve monitoring the interaction between the RSI line and the volatility bands, specifically looking for touchpoints or crossovers that suggest the current move has exhausted its available volume.
A simple yet effective exit strategy involves partial profit-taking. When the RSI line hits the outer volatility band, close 50 percent of the position. Move the remaining stop-loss to breakeven. This locks in gains while allowing the remaining portion of the trade to capture any extended momentum if the trend continues.
If the RSI line pulls back and crosses the signal line before it hits the other side of the bands, close the remainder of the trade. This indicates that the momentum has reversed prematurely and staying in the trade is no longer statistically justified. Discipline in following these exit rules prevents winning trades from turning into losses.
Frequently Asked Questions
This section provides answers to common inquiries regarding the effective application and configuration of the traders dynamic index indicator. Addressing these concerns helps traders refine their approach, ensuring that they maintain technical precision while navigating the complexities of the current October 2026 financial market landscape and volatility cycles.
- Is the traders dynamic index suitable for all timeframes? Yes, the indicator works across all timeframes. However, it is most reliable on the 15-minute chart and higher. Lower timeframes often contain too much noise for the indicator to produce accurate signals consistently.
- Can I use this indicator to trade binary options? While some traders use it for binary options, its design is intended for spot forex and CFD markets. If applied to short-duration options, ensure you combine it with strict support and resistance analysis to increase your probability of success.
- Why does the RSI line stay near the bands for so long? This occurs during strong trends when momentum remains persistent. This is called “banding.” During these periods, do not try to fade the move. Stay with the trend until the RSI line crosses the signal line in the opposite direction.
- How do I fix the indicator if it doesn’t show up on my chart? Ensure the file is placed in the “Indicators” folder of your MT4/MT5 data directory. After pasting the file, restart your platform or right-click in the Navigator window and select “Refresh.” Check the “Allow DLL imports” setting in the indicator properties.