

Professional market participants operate within a ecosystem defined by the continuous search for resting orders. A liquidity sweep occurs when price action temporarily extends beyond established support or resistance levels, specifically designed to trigger stop-loss orders and force retail liquidations before reversing direction. By identifying these zones of concentrated volume, traders can align their positions with the directional bias of large-scale financial institutions.
Successful execution requires a shift in mindset: stop viewing support and resistance as hard walls, and start viewing them as magnets for market participation. Institutional algorithms target these levels to source the necessary liquidity to fill massive buy or sell orders. When you understand the anatomy of a liquidity sweep, you stop becoming the victim of the stop-run and start positioning yourself alongside the primary trend as it gathers momentum.
- Explore pairing liquidity raids with breaker block trading setups.
- Explore monitoring volume delta imbalances in our order flow trading guide.
- Explore mastering institutional order flow in the complete ICT trading strategy guide.
Understanding Institutional Liquidity Raids
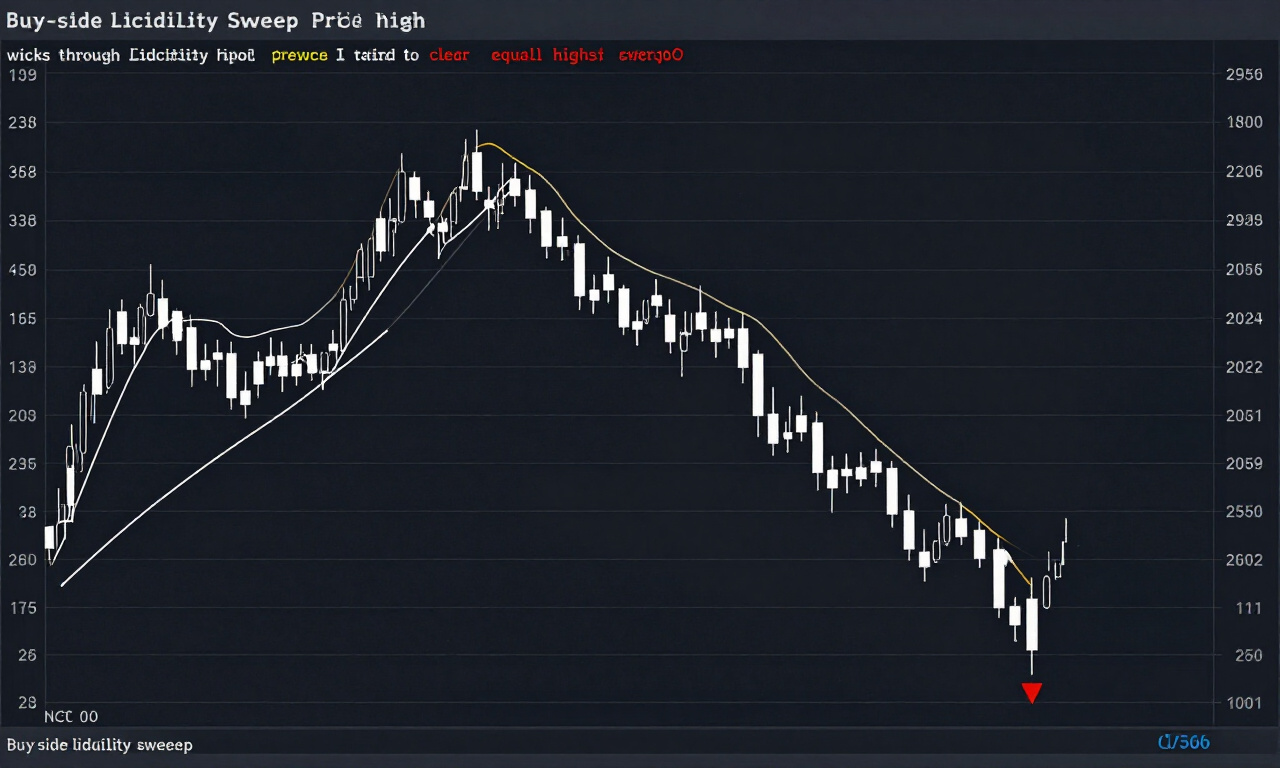
A liquidity raid represents an intentional price movement beyond key technical levels to trigger clusters of stop-loss orders. These raids provide the essential volume needed for institutional entities to execute large position sizes without causing excessive slippage. By absorbing the retail liquidity, these entities create the conditions for a subsequent reversal.
Retail trading textbooks often teach support and resistance as points of bounce. In reality, these zones are areas where retail traders place stop-loss orders. When price approaches a low, the build-up of sell-stop orders creates a deep pool of liquidity. Institutions view this pool as an opportunity to buy at a discount.
The mechanics of a raid function through three distinct phases: the accumulation phase, the stop-run, and the displacement. During the stop-run, price creates a fake-out, breaking beneath the level to capture the liquidity. Once the orders are filled, the institutional footprint becomes visible through a rapid displacement in the opposite direction.
Practitioner Pro-Tip: Always monitor the speed of price action as it hits a liquidity zone. A slow, grinding approach often signals a retest, while a sharp, high-momentum spike is the hallmark of a liquidity raid designed to trigger stops.
Buy-Side Liquidity Sweeps
A buy-side liquidity sweep occurs when price moves above a recent high, triggering buy-stop orders and short-covering activity. This action allows institutional sellers to fill large short positions by absorbing the retail buying pressure. Once the buying is exhausted, the market typically fails and breaks lower with increased speed.
Buy-side liquidity is found resting above relative equal highs (REHs) or swing highs. When traders place buy-stop orders to enter breakouts, they inadvertently provide liquidity to institutional sellers. If the market pushes into these levels but fails to hold, the sweep is confirmed.
To identify these events, watch for a clean break of a previous high followed by a candle closure back inside the range. This “False Breakout” structure is a high-probability reversal signal. It suggests that the buying interest at those levels was insufficient to sustain the move, and the trap is set for a downward push.
Sell-Side Liquidity Sweeps
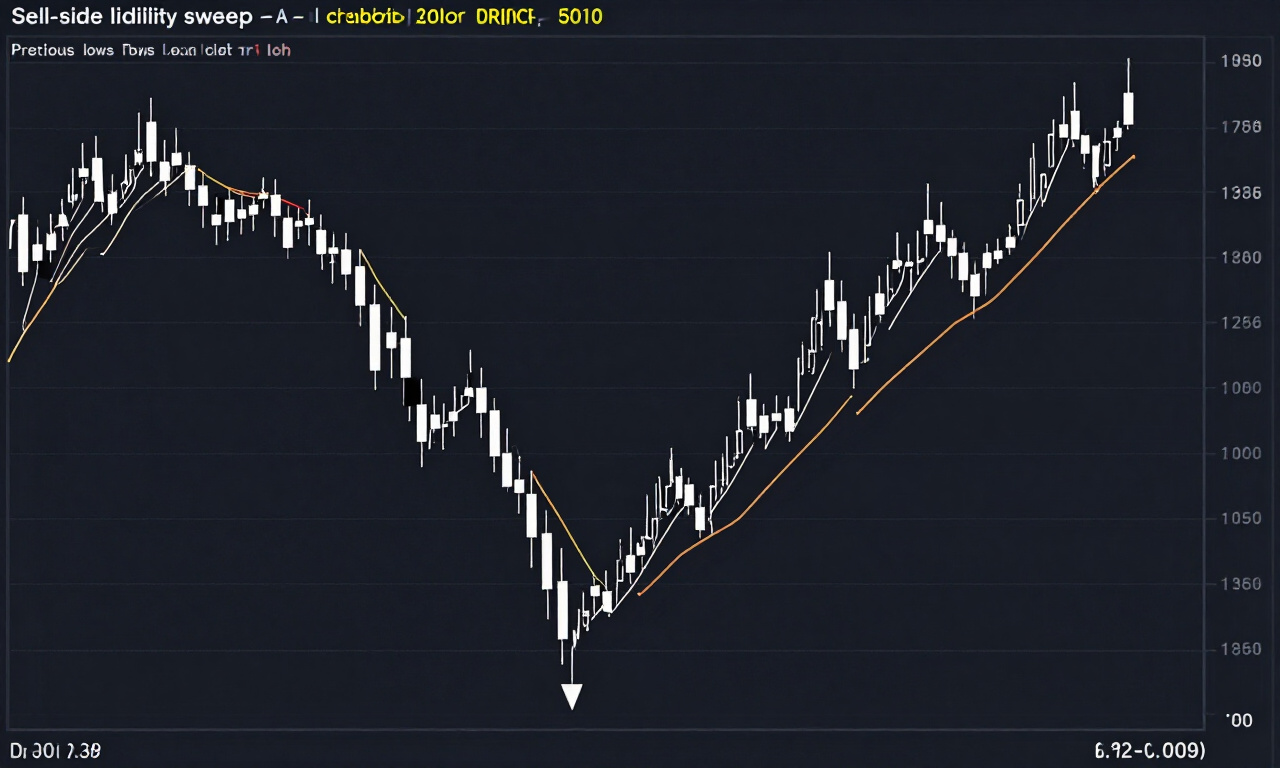
A sell-side liquidity sweep involves price dipping below established swing lows, activating sell-stop orders and long liquidation events. This process provides institutions with the sell-side volume necessary to fill large long positions. After the sweep, the market lacks remaining sell-side pressure, leading to a strong recovery move.
Sell-side liquidity is concentrated below relative equal lows (RELs) and multi-swing lows. These are the primary targets for market makers seeking to acquire assets at lower valuations. The key to trading this is patience, as the sweep can often extend deeper than anticipated before the reversal takes hold.
When price sweeps sell-side liquidity, the indicator is a rapid wick rejection on the lower time frame. You are looking for price to pierce the low and instantly return to the previous range. This suggests the stop-loss hunt is complete and the market is now ready to trend in the intended direction of the larger institution.
Entry Confirmation Setups
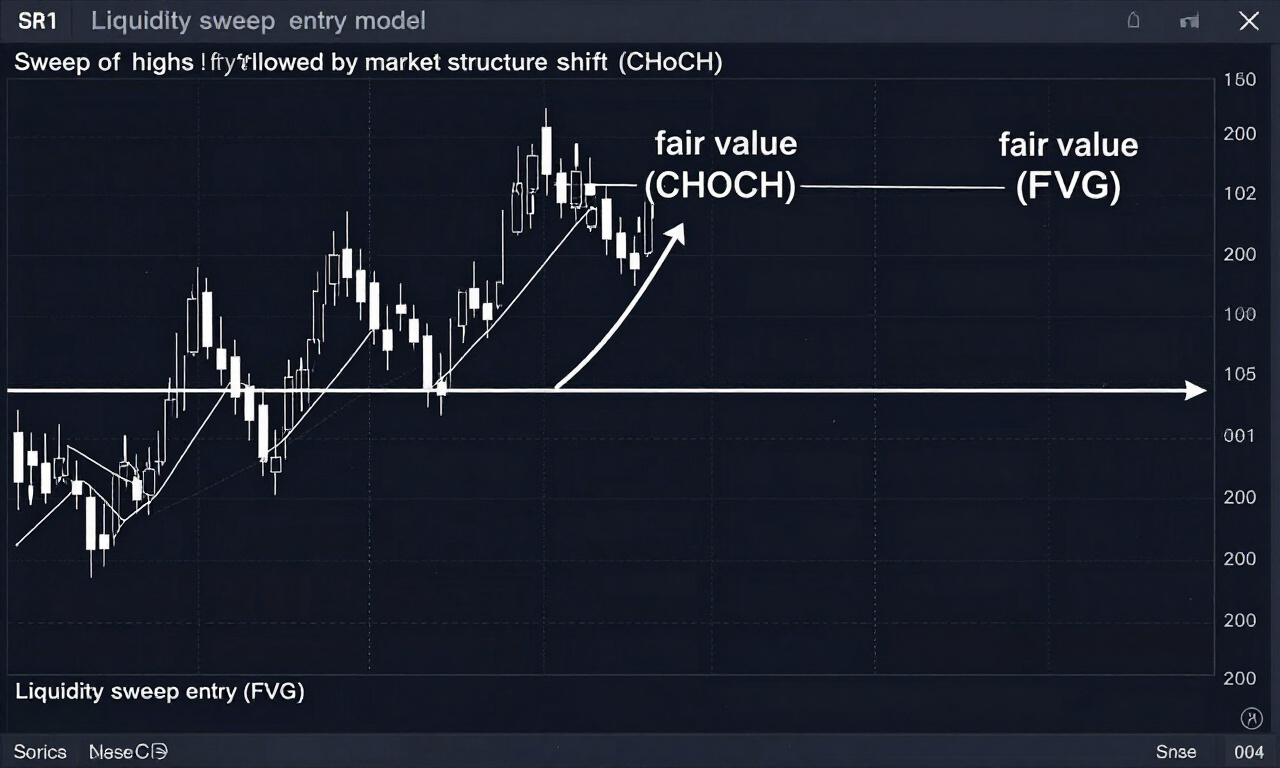
Entry confirmation following a liquidity sweep requires observing a market structure shift on a lower time frame. By waiting for the breach to fail and for price to break the most recent minor swing, traders ensure that the liquidity sweep has actually resulted in a change of trend direction.
Do not attempt to catch a falling knife by entering during the sweep itself. The market can often extend further than predicted. Instead, use a two-step confirmation process to filter out noise and increase your probability of success. Consistency in execution is the hallmark of a professional trader.
- Step 1: Wait for the liquidity sweep to occur (price breaking a high/low).
- Step 2: Observe the candle close—a strong wick rejection is essential.
- Step 3: Look for a market structure break (MSB) on a lower time frame.
- Step 4: Execute a limit entry upon the retest of the order block created by the move.
This approach minimizes your risk exposure by requiring evidence of commitment from the larger market participants. You are essentially waiting for the institution to show their hand before you commit your capital to the trade.
Risk Management in Sweep Trading
Managing risk during liquidity hunts involves placing stops behind the extreme of the sweep wick rather than just behind the previous support level. Because these areas are inherently volatile, wide stop-losses are often necessary to account for the brief, intense price spikes that characterize institutional order filling.
A common mistake is placing a tight stop directly behind the low that was swept. Institutions often return to re-test the absolute extreme of the sweep before moving away. By giving your trade breathing room, you prevent being stopped out by a secondary minor sweep or a simple spread adjustment.
Use position sizing to ensure your risk remains constant regardless of the stop width. If the sweep looks deeper than usual, reduce the lot size to keep the dollar amount of your risk within your allowed per-trade maximum. Professionalism in trading is defined by protecting capital during periods of high market turbulence.
Applying Liquidity Analysis in 2026 and October
Applying modern liquidity analysis requires an understanding of how automated algorithmic trading systems target specific volume zones across all major currency pairs. In 2026, these models are increasingly efficient, requiring traders to look at liquidity at multiple time frames to confirm the true institutional bias before making any decisions.
Data suggests that currency markets exhibit higher liquidity concentration during the London-New York overlap. This is when institutional order flow is at its peak. During these windows, liquidity sweeps are more frequent and often carry more conviction than during the quiet Asian session, where sweeps can be less reliable.
Always align your trades with the daily and weekly bias. If the daily trend is bullish, favor buy-side liquidity sweeps that fail to hold. If you find yourself in a range-bound environment, look to trade the sweeps of both high and low liquidity pools as part of a range-reversal strategy.
Frequently Asked Questions
This section provides answers to common inquiries regarding liquidity sweep strategies. Understanding these mechanisms is vital for any trader looking to move beyond basic technical analysis and begin trading in alignment with institutional order flow patterns. These answers cover the most frequent hurdles faced by traders today.
- What is the best time frame to spot a liquidity sweep?
While sweeps occur on all time frames, the 1-hour and 4-hour charts provide the most reliable signals for trend direction. Use the 5-minute chart for surgical entry refinement once the sweep is confirmed on the higher time frame. - How can I tell the difference between a sweep and a breakout?
A breakout is characterized by sustained price movement away from the level with increased volume. A liquidity sweep is characterized by a “fake-out” wick followed by an immediate reversal back into the range. - Do liquidity sweeps work in all market conditions?
They are most effective in range-bound and consolidating markets. In strong, news-driven trending environments, price may break levels and continue, ignoring the liquidity sweep setup entirely. Always check the economic calendar. - Should I use indicators to identify sweeps?
Volume and Market Structure are the primary indicators. Avoid lagging indicators like moving averages, as they often confuse the true price action of a sweep. Focus strictly on how price interacts with previous highs and lows.